

Belle Chang, MBA

David McNay, CFA
key takeaways
- Japan’s growth strategy has moved from broad policy direction to a concrete investment roadmap, with the cabinet having approved a JPY370 trillion (~$2.4 trillion package).
- The framework is broad based – targeting 17 strategic sectors and 62 products in areas from AI to healthcare to anime & gaming.
- For investors this is not a laser focused bet on one industry, like AI, but rather a broad tailwind that may affect circa. half of the sectors in the FTSE Japan Index.
Prime Minister Takaichi and her team have been busy in the six months since her landslide election victory in February. Japan’s Growth Strategy has moved from broad policy direction towards a more concrete investment roadmap. In July, the Cabinet approved a strategy that builds on the 17 strategic fields identified by the Takaichi administration, into 62 priority products and technologies and targeting more than JPY 370 trillion (~ USD 2.4 trillion) of investment through FY2040.
Importantly, the JPY 370 trillion target represents a combined public- and private investment roadmap rather than government spending alone. The public-private split is unknown, which makes the fiscal implications uncertain, but suggesting that the direct fiscal burden could be considerably smaller than the headline figure implies. Cabinet approval is not the same as parliamentary approval, but as we discussed in “Can the rock star of Japanese politics drum to the beat of the markets?”, the Prime Minister’s supermajority should help reduce political friction.
The framework is intended to strengthen Japan’s supply capacity and competitiveness in strategically important industries, with multi-year policy support and sector-specific investment targets. AI and semiconductors are among the largest areas of focus, but the strategy extends beyond technology into defense, healthcare, energy, natural resources, content and other areas.
This breadth is particularly relevant for Japanese equities. Unlike Asian peers Korea and Taiwan, whose markets are dominated[note1] by Technology and physical-AI-enabler-related sectors, the Japanese equity market is relatively more balanced across industries. The Growth Strategy’s support across a diverse range of strategic fields could therefore translate into a broader set of equity beneficiaries, rather than concentrating on the policy tailwind in a small number of AI or technology related areas.
Figure 1: FTSE Japan industry weights
Mapping FTSE Japan's subsectors against the 17 strategic fields suggests that around 51% of the index may benefit from the Growth Strategy; excluding Financials[note2] then circa. 60% of the FTSE Japan Index has some exposure to the government's strategic priorities. This highlights the breadth of the initiative: unlike a narrowly targeted technology policy, the Growth Strategy spans AI and semiconductors, digital infrastructure, defense, aerospace, advanced materials, energy, healthcare, logistics, food technology and content.
How are the policy-exposed sectors performing?
YTD FTSE Japan has risen 21.9%, as of September 2026, outperforming most of other APAC markets, and the FTSE All-World Index (13.3%). Importantly, several sectors exposed to the Growth Strategy also outperformed their respective peers.
Figure 2: Japan's policy-exposed sectors – performance versus regional and global peers
Electronic and Electrical Equipment, and Technology Hardware and Equipment performed strongly, ahead of global counterparts. As discussed in Digital AI to physical AI enablers: Asia benefits, these sectors sit at the heart of Japan's physical AI ecosystem, and are benefiting from the global AI capex cycle as well as domestic policy support. The Growth Strategy reinforces this structural theme: AI and semiconductors are among its largest areas of planned investment, including semiconductors, physical AI, cloud and data-center infrastructure.
Several industrial sectors, including Chemicals, General Industrials, Industrial Metals and Mining, and Industrial Support Services, have also outperformed global peers, while appearing more attractively valued on measures like PB/ROE. Many of these industries are related to physical AI enablers and advanced manufacturing, such as semiconductor equipment, automation, specialty materials and critical resources.
Industrial Support Services’ constituents capture several themes. Major trading houses, including Mitsui & Co., Sumitomo Corp. and Marubeni, have diversified businesses spanning to resources, energy, infrastructure and critical materials, creating exposure to areas prioritized under the Growth Strategy, such as resource and energy security and GX. The Growth Strategy is therefore potentially supportive not only of specialist technology companies, but also of diversified Japanese businesses that finance, develop and operate strategic assets across multiple industries.
Telecommunications Service Providers look richly valued relative to peers but largely that is the inclusion of SoftBank – which has material direct exposure to the broader AI theme. Beyond SoftBank other names tap into next-generation wireless and submarine cables which are targeted products in the Growth Strategy.
Leisure Goods, mainly led by Toys stocks, outperformed regional and global peers. Takaichi’s government has identified games, anime, manga, music and live-action content as part of the 17 strategic fields, aiming to expand the global reach and monetization of Japanese intellectual property. For instance, the Toys subsector offers a relatively direct link through stocks like Bandai Namco. The company operates an IP-centric business model spanning anime, manga, games and character merchandise, allowing popular Japanese IP to be monetized across multiple products and markets. Bandai Namco's strategy also increasingly emphasizes overseas expansion and maximizing the value of its IP, closely aligning with the government's ambition to turn Japan's strength in content into a larger global industry.
In contrast, performance has been more mixed in healthcare-related sectors. Pharmaceuticals and Biotechnology have delivered only modest returns despite healthcare being one of the 17 strategic fields. Near-term industry and company-specific headwinds have continued to outweigh the potential benefits of longer-term policy support in parts of the healthcare sector.
Figure 3: P/B versus ROE for Japan’s policy-exposed sectors and global peers
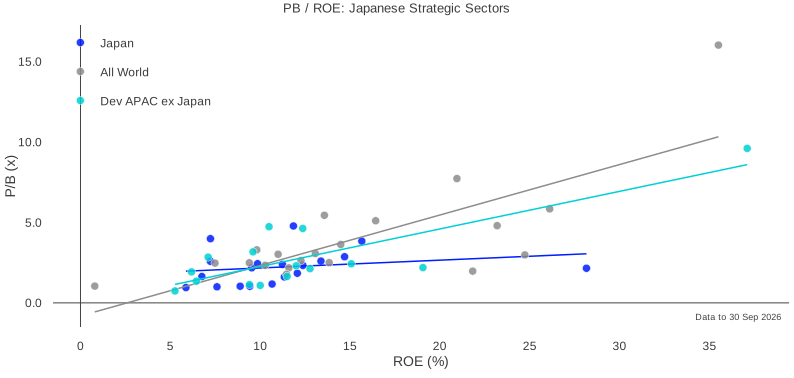
Source: FTSE Russell and LSEG. Data as of September 2026. Past performance is not a guide to future returns. Please see the end for important legal disclosures.
| Series | Point | ROE (%) | P/B (x) |
|---|---|---|---|
| Japan | 1 | 5.4 | 0.8 |
| Japan | 2 | 6.0 | 1.0 |
| Japan | 3 | 6.3 | 1.6 |
| Japan | 4 | 7.2 | 4.0 |
| Japan | 5 | 7.6 | 0.9 |
| Japan | 6 | 8.8 | 1.0 |
| Japan | 7 | 9.4 | 1.0 |
| Japan | 8 | 10.0 | 1.0 |
| Japan | 9 | 10.7 | 2.4 |
| Japan | 10 | 11.2 | 1.7 |
| Japan | 11 | 11.6 | 2.2 |
| Japan | 12 | 12.0 | 4.8 |
| Japan | 13 | 12.3 | 1.9 |
| Japan | 14 | 12.8 | 2.4 |
| Japan | 15 | 13.8 | 2.5 |
| Japan | 16 | 14.7 | 2.8 |
| Japan | 17 | 15.3 | 2.4 |
| Japan | 18 | 15.8 | 3.8 |
| Japan | 19 | 28.5 | 2.1 |
| All World | 1 | 0.8 | 1.0 |
| All World | 2 | 6.7 | 2.5 |
| All World | 3 | 8.8 | 2.0 |
| All World | 4 | 9.4 | 2.7 |
| All World | 5 | 10.0 | 3.1 |
| All World | 6 | 10.8 | 2.1 |
| All World | 7 | 11.4 | 2.6 |
| All World | 8 | 12.0 | 2.3 |
| All World | 9 | 12.8 | 3.0 |
| All World | 10 | 13.2 | 5.5 |
| All World | 11 | 14.0 | 3.3 |
| All World | 12 | 14.8 | 3.6 |
| All World | 13 | 16.5 | 5.2 |
| All World | 14 | 21.0 | 7.8 |
| All World | 15 | 21.8 | 2.0 |
| All World | 16 | 23.2 | 4.9 |
| All World | 17 | 25.0 | 3.0 |
| All World | 18 | 26.5 | 5.9 |
| All World | 19 | 35.0 | 16.0 |
| Dev APAC ex Japan | 1 | 5.0 | 0.7 |
| Dev APAC ex Japan | 2 | 5.8 | 1.2 |
| Dev APAC ex Japan | 3 | 6.0 | 1.9 |
| Dev APAC ex Japan | 4 | 6.2 | 1.4 |
| Dev APAC ex Japan | 5 | 7.0 | 2.8 |
| Dev APAC ex Japan | 6 | 9.0 | 1.0 |
| Dev APAC ex Japan | 7 | 9.6 | 3.2 |
| Dev APAC ex Japan | 8 | 10.2 | 1.1 |
| Dev APAC ex Japan | 9 | 10.8 | 4.8 |
| Dev APAC ex Japan | 10 | 11.5 | 2.0 |
| Dev APAC ex Japan | 11 | 12.0 | 1.8 |
| Dev APAC ex Japan | 12 | 12.5 | 4.6 |
| Dev APAC ex Japan | 13 | 13.0 | 2.7 |
| Dev APAC ex Japan | 14 | 14.0 | 2.5 |
| Dev APAC ex Japan | 15 | 15.0 | 2.4 |
| Dev APAC ex Japan | 16 | 19.0 | 2.2 |
| Dev APAC ex Japan | 17 | 37.0 | 9.6 |
Conclusion
Since the election in February, PM Takaichi and her administration have been busy trying to turn broad fiscally expansionary policy into tangible policy – identifying 17 strategic fields and 62 priority products. For equity investors these span a wide number of sectors, touching around half of the FTSE Japan Index.
Importantly, this is not a concentrated gust behind just Artificial Intelligence. Rather, it is a broad, multi-year tailwind for several sectors considered strategically important – this includes AI, quantum computing, healthcare, defense, energy security and more.
Gotta grow ‘em all.
footnotes
[1] Technology and physical AI enablers accounted for 73.5% and 93.1% of the FTSE Korea and FTSE Taiwan Indices respectively as of September 30, 2026. | Back to Note 1
[2] Financials represent circa. 18% of the FTSE Japan index but are more difficult to map to the strategic growth sectors as they would form part of the transmission mechanism. | Back to Note 2

Disclaimer
© [2026] London Stock Exchange Group plc and its applicable group undertakings (“LSEG”). LSEG includes (1) FTSE International Limited (“FTSE”), (2) Frank Russell Company (“Russell”), (3) FTSE Global Debt Capital Markets Inc. “FTSE Canada”, (4) FTSE Fixed Income LLC (“FTSE FI”), (5) FTSE (Beijing) Consulting Limited (“WOFE”), (6) FTSE EU SAS ("FES"). All rights reserved.
FTSE Russell® is a trading name of FTSE, Russell, FTSE Canada, FTSE FI, WOFE, FTSE EU and other LSEG entities providing LSEG Benchmark and Index services. “FTSE®”, “Russell®”, “FTSE Russell®”, “FTSE4Good®”, “ICB®”, “Refinitiv”, “WMR™” “FR™” and all other trademarks and service marks used herein (whether registered or unregistered) are trademarks and/or service marks owned or licensed by the applicable member of LSEG or their respective licensors.
FTSE International Limited is authorised as a Benchmark Administrator and regulated in the United Kingdom (UK) by the Financial Conduct Authority ("FCA") according to the UK Benchmark Regulation, FCA Reference Number 796803. FTSE EU SAS is authorised as Benchmark Administrator and regulated in the European Union (EU) by the Autorité des Marches Financiers (“AMF”) according to the EU Benchmark Regulation.
All information is provided for information purposes only. All information and data contained in this publication is obtained by LSEG, from sources believed by it to be accurate and reliable. Because of the possibility of human and mechanical inaccuracy as well as other factors, however, such information and data is provided "as is" without warranty of any kind. No member of LSEG nor their respective directors, officers, employees, partners or licensors make any claim, prediction, warranty or representation whatsoever, expressly or impliedly, either as to the accuracy, timeliness, completeness, merchantability of any information or LSEG Products, or of results to be obtained from the use of LSEG products, including but not limited to indices, rates, data and analytics, or the fitness or suitability of the LSEG products for any particular purpose to which they might be put. The user of the information assumes the entire risk of any use it may make or permit to be made of the information.
No responsibility or liability can be accepted by any member of LSEG nor their respective directors, officers, employees, partners or licensors for (a) any loss or damage in whole or in part caused by, resulting from, or relating to any inaccuracy (negligent or otherwise) or other circumstance involved in procuring, collecting, compiling, interpreting, analysing, editing, transcribing, transmitting, communicating or delivering any such information or data or from use of this document or links to this document or (b) any direct, indirect, special, consequential or incidental damages whatsoever, even if any member of LSEG is advised in advance of the possibility of such damages, resulting from the use of, or inability to use, such information.
No member of LSEG nor their respective directors, officers, employees, partners or licensors provide investment advice and nothing in this document should be taken as constituting financial or investment advice. No member of LSEG nor their respective directors, officers, employees, partners or licensors make any representation regarding the advisability of investing in any asset or whether such investment creates any legal or compliance risks for the investor. A decision to invest in any such asset should not be made in reliance on any information herein. Indices and rates cannot be invested in directly. Inclusion of an asset in an index or rate is not a recommendation to buy, sell or hold that asset nor confirmation that any particular investor may lawfully buy, sell or hold the asset or an index or rate containing the asset. The general information contained in this publication should not be acted upon without obtaining specific legal, tax, and investment advice from a licensed professional.
Past performance is no guarantee of future results. Charts and graphs are provided for illustrative purposes only. Index and/or rate returns shown may not represent the results of the actual trading of investable assets. Certain returns shown may reflect back-tested performance. All performance presented prior to the index or rate inception date is back-tested performance. Back-tested performance is not actual performance, but is hypothetical. The back-test calculations are based on the same methodology that was in effect when the index or rate was officially launched. However, back-tested data may reflect the application of the index or rate methodology with the benefit of hindsight, and the historic calculations of an index or rate may change from month to month based on revisions to the underlying economic data used in the calculation of the index or rate.
This document may contain forward-looking assessments. These are based upon a number of assumptions concerning future conditions that ultimately may prove to be inaccurate. Such forward-looking assessments are subject to risks and uncertainties and may be affected by various factors that may cause actual results to differ materially. No member of LSEG nor their licensors assume any duty to and do not undertake to update forward-looking assessments.
No part of this information may be reproduced, stored in a retrieval system or transmitted in any form or by any means, electronic, mechanical, photocopying, recording or otherwise, without prior written permission of the applicable member of LSEG. Use and distribution of LSEG data requires a licence from LSEG and/or its licensors.