

Robert Bush

Carter Johnson
The broadening of US equity market performance, and the lower P/Es in the third quarter.
Key Takeaways
- Large caps and value regained leadership in Q3. Higher bond yields and tighter financial conditions favoured larger companies and value-oriented sectors, while weighing on small caps and growth stocks.
- Small-cap participation has weakened but remains intact. Despite underperforming in Q3, small caps continue to lead large caps over longer time periods, suggesting market broadening has slowed rather than reversed.
- Valuations have reset to healthier levels. Higher rates compressed valuation multiples across the market, but resilient earnings growth helped support equity prices and kept valuations near historical norms.
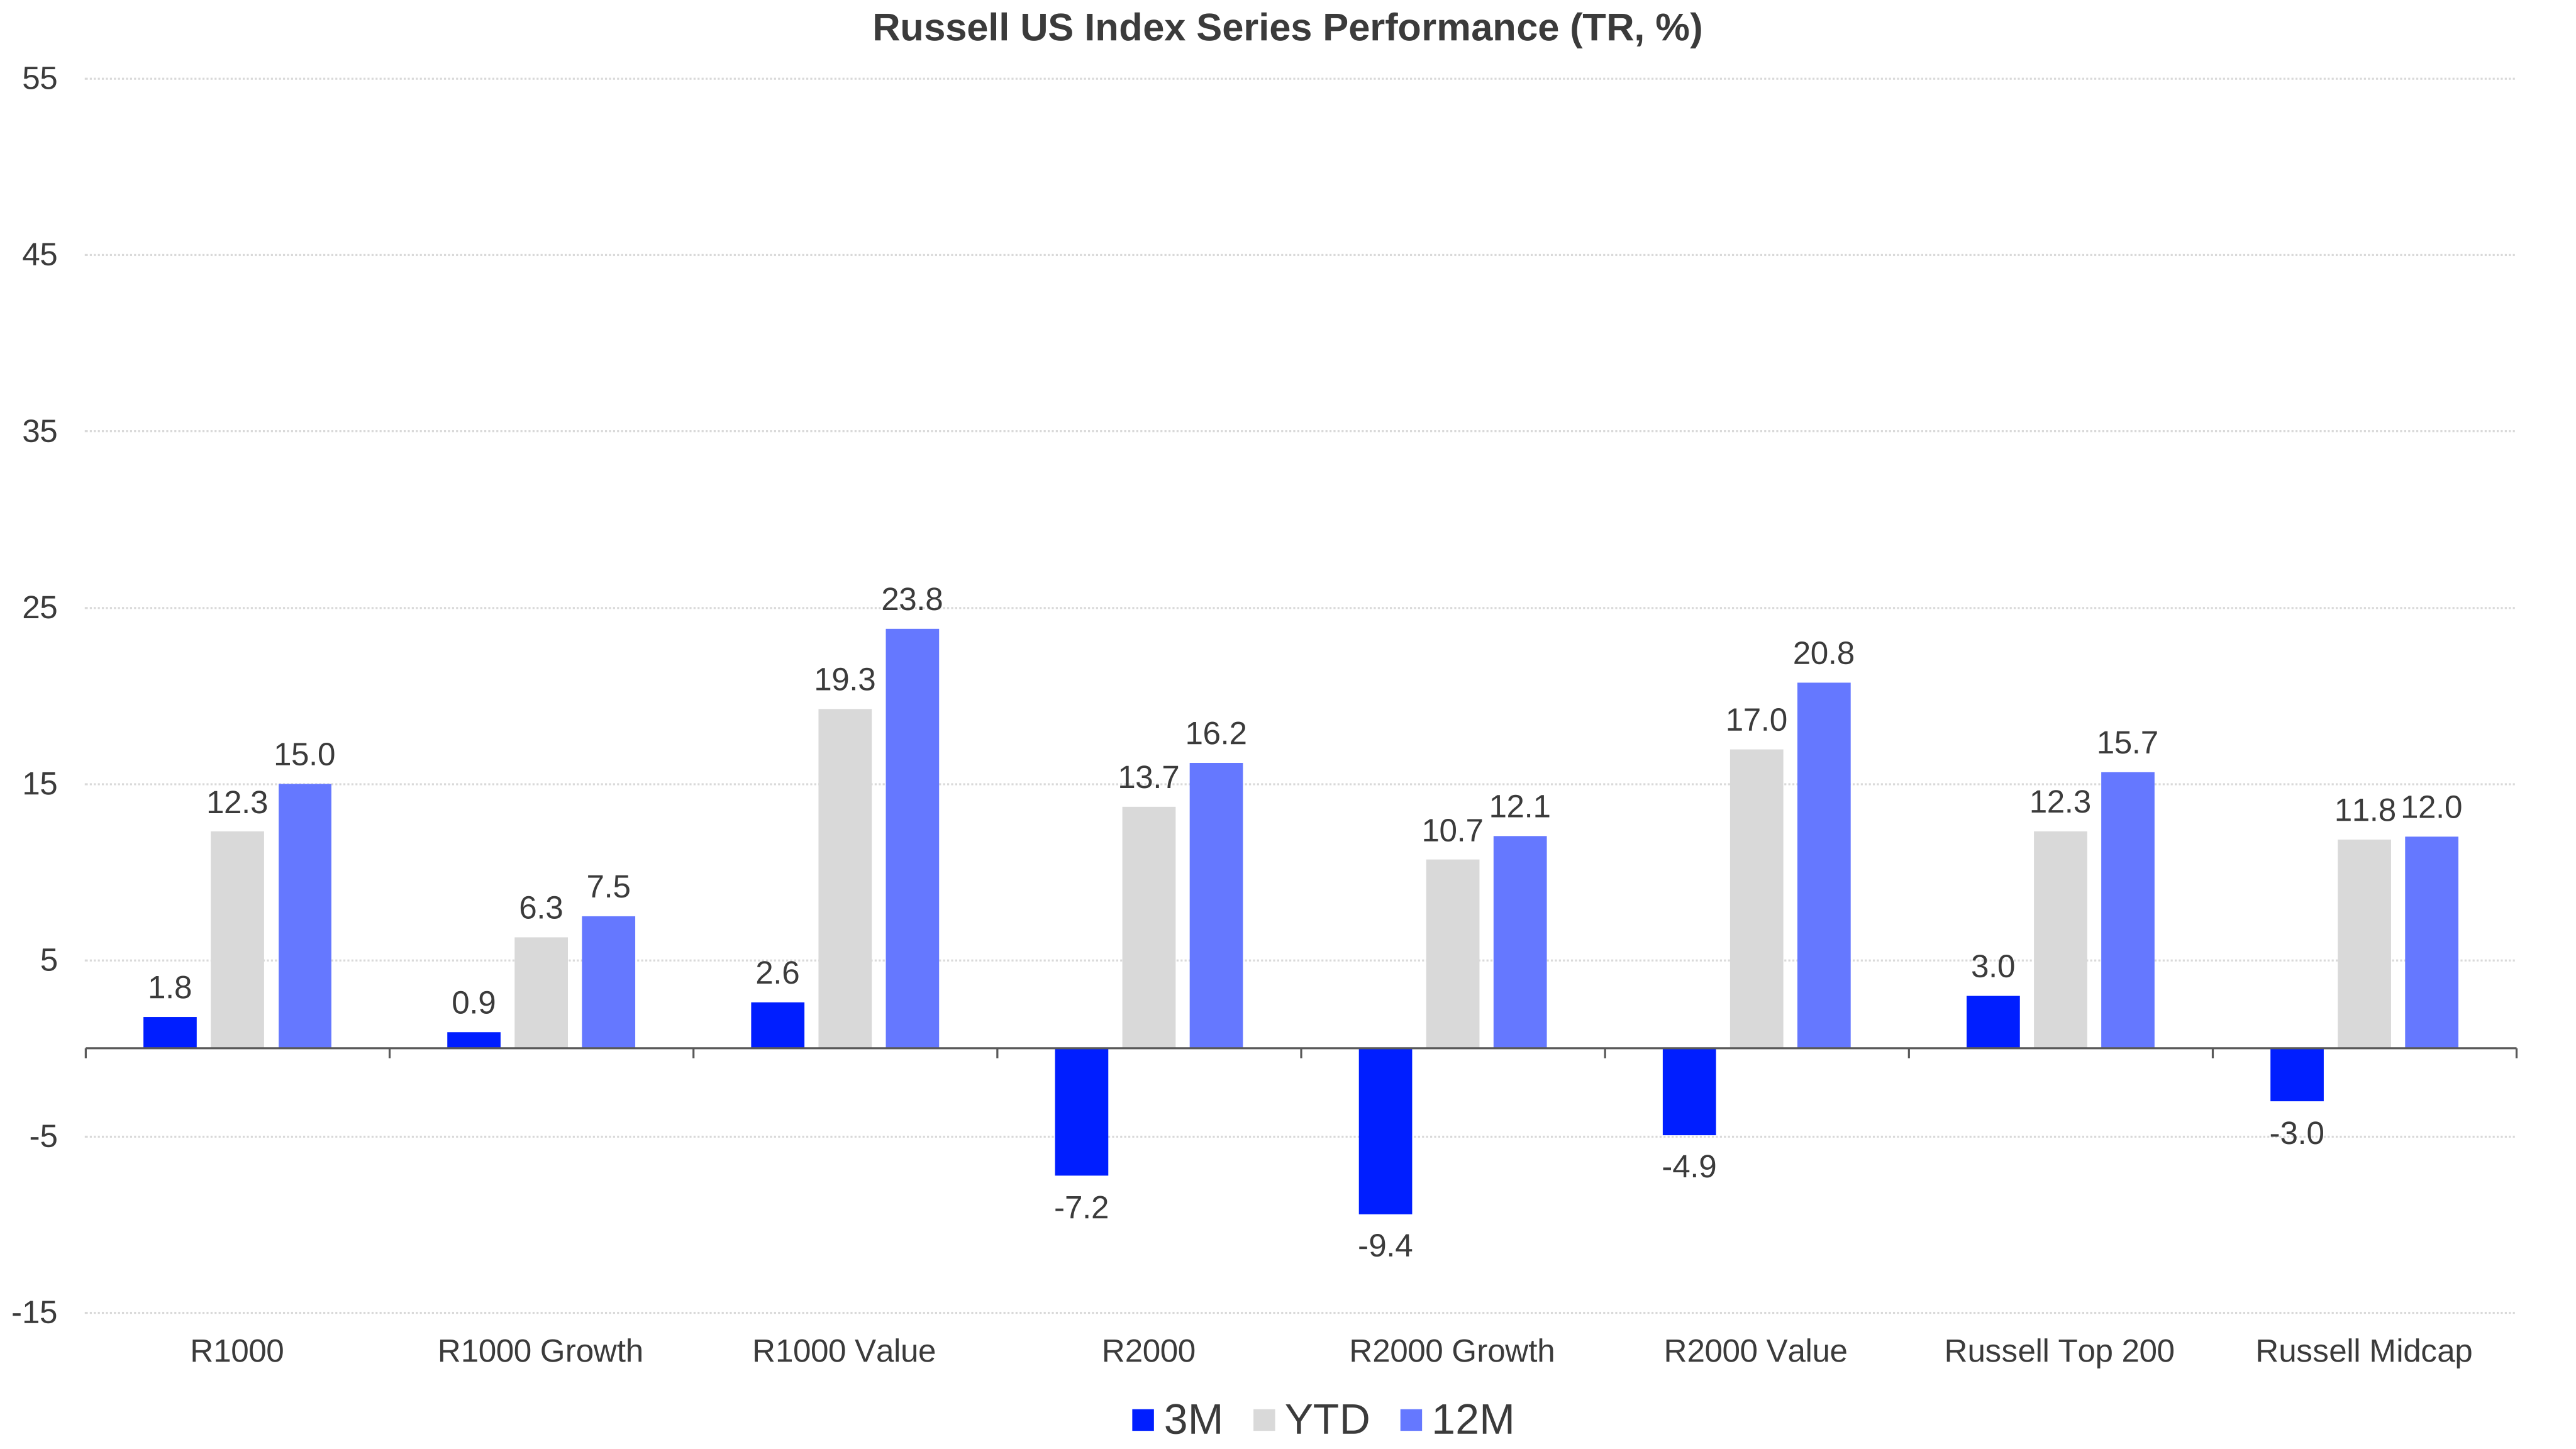
We recently released our third quarter Russell US Indexes Spotlight, and noted several interesting developments in the US equity space. Firstly, the third quarter marked an important shift in market leadership, with large-cap stocks regaining the advantage over small-caps after several quarters of broadening market participation. While the Russell 2000 had outperformed during the second quarter, the Russell 1000 returned 1.8% in Q3 compared with a decline of 7.2% for the Russell 2000, highlighting the challenges faced by smaller companies as financial conditions tightened, and bond yields moved higher. Despite this setback, small-caps continued to maintain an advantage over longer horizons, with the Russell 2000 delivering 16.2% over the previous 12 months, versus 15.0% for the Russell 1000.
Secondly, style leadership also favoured Value over Growth across both market-cap segments. Within large-caps, the Russell 1000 Value Index gained 2.6% during the quarter, comfortably ahead of the 0.9% return generated by the Russell 1000 Growth Index. The pattern was even more pronounced among small-caps, where the Russell 2000 Value Index declined 4.9%, outperforming the Russell 2000 Growth Index, which fell 9.4%.
We believe that much of this performance dispersion can be attributed to the higher-rate environment in the third quarter. For much of this year we have witnessed rising Treasury yields, and our view is that these naturally act as a headwind for longer-duration growth assets and rate-sensitive small-caps, while sectors more heavily represented within value indices benefited from stronger commodity prices and resilient economic activity. Energy-related companies were among the strongest performers during the quarter, supported by higher oil prices, while Precious Metals and Mining also contributed positively.
Chart One illustrates these two key themes currently shaping US equity markets, but which are playing out over different timeframes: in the short run, a renewed preference for large-cap companies, and continued value outperformance. But, in contrast to that, longer-term data which shows that small-cap equities remain competitive on both a year-to-date and trailing 12-month basis - suggesting that broadening market participation has slowed rather than disappeared. Investors therefore continue to balance the defensive appeal of larger, more profitable businesses against the potential earnings recovery still expected within segments of the small-cap universe.
Chart One: A volatile third quarter, but longer run equity broadening
Source: FTSE Russell and LSEG. Data as of September 2026. Past performance is not a guide to future returns. Please see the end for important legal disclosures.
| Russell US index | 3M (%) | YTD (%) | 12M (%) |
|---|---|---|---|
| Russell 1000 | 1.8 | 12.3 | 15.0 |
| Russell 1000 Growth | 0.9 | 6.3 | 7.5 |
| Russell 1000 Value | 2.6 | 19.3 | 23.8 |
| Russell 2000 | -7.2 | 13.7 | 16.2 |
| Russell 2000 Growth | -9.4 | 10.7 | 12.1 |
| Russell 2000 Value | -4.9 | 17.0 | 20.8 |
| Russell Top 200 | 3.0 | 12.3 | 15.7 |
| Russell Midcap | -3.0 | 11.8 | 12.0 |
Building on the performance trends discussed above, valuations became a more important driver of returns during the third quarter as higher bond yields and a more hawkish policy backdrop led investors to reassess the price they were willing to pay for future earnings. While earnings expectations remained broadly resilient, particularly in growth-oriented sectors, multiples moved lower across almost every major Russell segment.
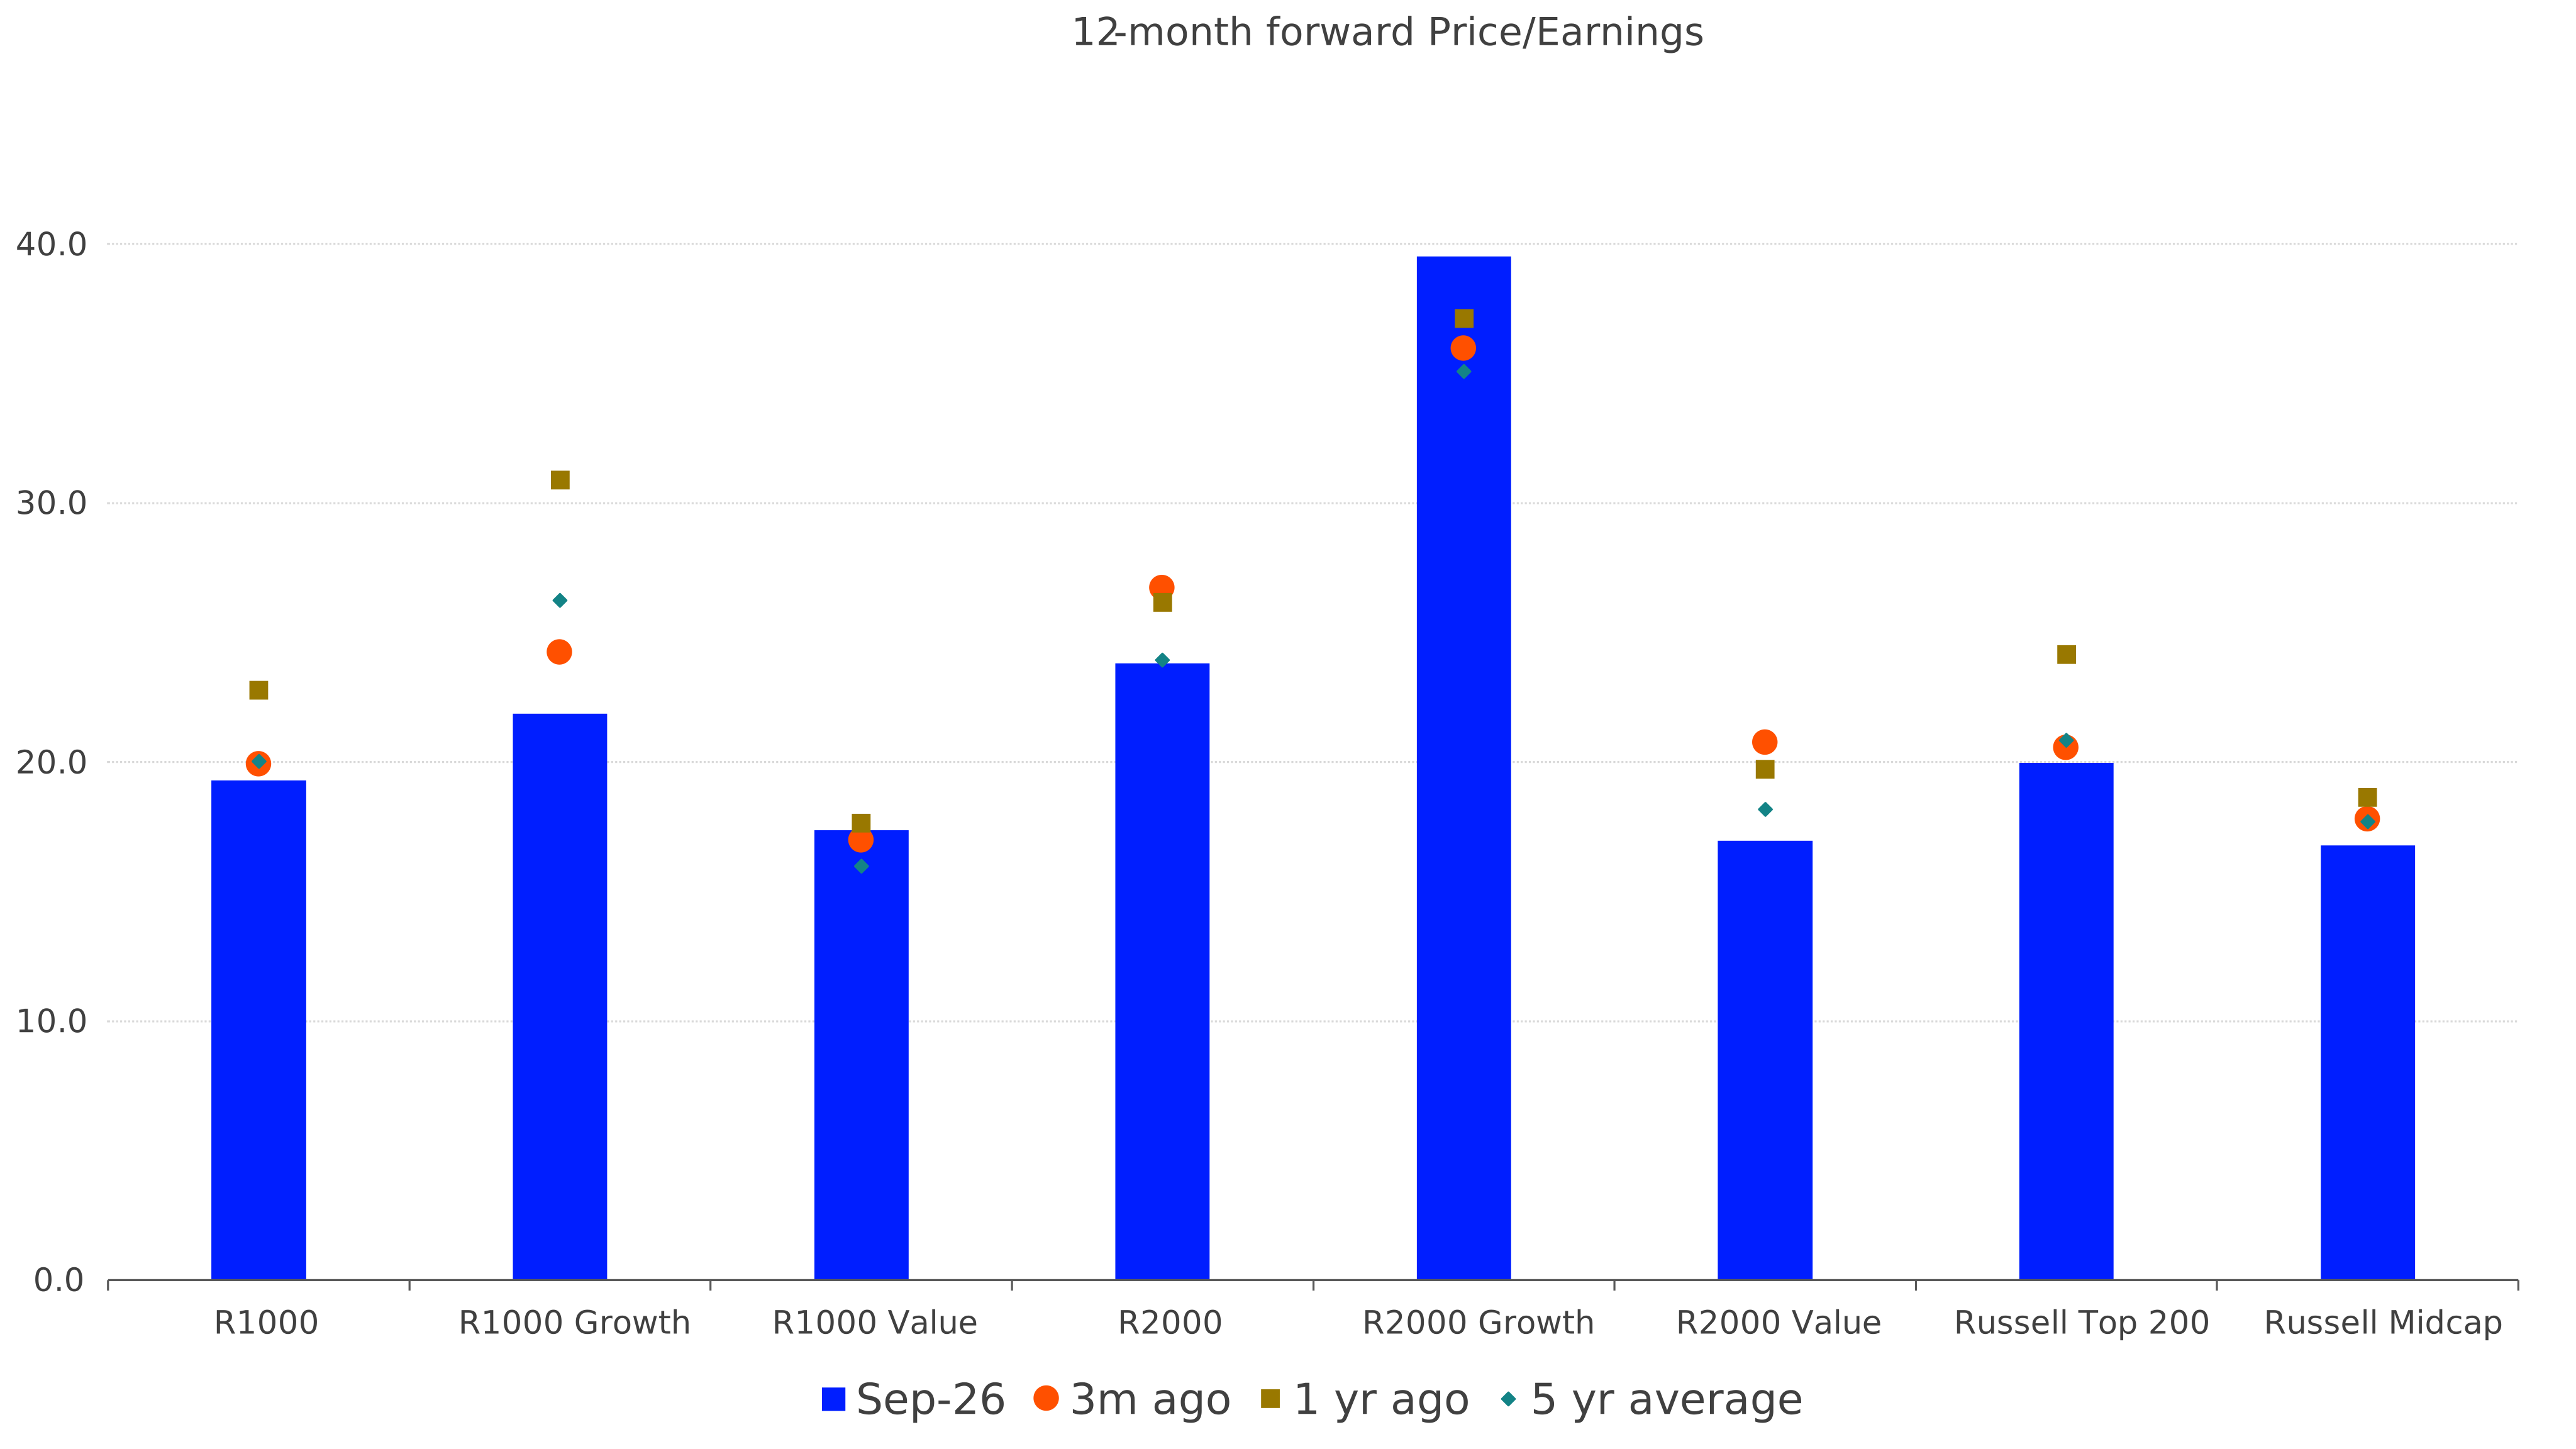
Chart Two highlights the broad-based valuation de-rating across both large and small-cap equities. Twelve-month forward P/E ratios declined across nearly all Russell 1000 and Russell 2000 style indexes during Q3, with most segments ending the quarter below their levels of a year earlier. Despite these declines, a sizeable valuation premium remains attached to growth stocks, particularly within the small-cap universe, reflecting investors' continued willingness to pay for stronger expected earnings growth and exposure to structural themes such as artificial intelligence.
At first glance, the combination of falling valuations and generally positive equity returns may appear contradictory. However, the market's performance over recent quarters has increasingly been supported by rising earnings expectations rather than multiple expansion. As Treasury yields pushed to multi-decade highs and the Federal Reserve maintained a restrictive stance, higher discount rates created a natural headwind for equity valuations. The result was that earnings growth continued to support share prices, but investors became less willing to extend valuation multiples further.
Chart Two: Less expensive, but hardly cheap…
Source: FTSE Russell and LSEG. Data as of September 2026. Past performance is not a guide to future returns. Please see the end for important legal disclosures.
| Russell US index | Sep 2026 | 3 months ago | 1 year ago | 5-year average |
|---|---|---|---|---|
| Russell 1000 | ~19.2 | ~19.9 | ~22.7 | ~20.0 |
| Russell 1000 Growth | ~21.8 | ~24.2 | ~30.8 | ~26.2 |
| Russell 1000 Value | ~17.4 | ~16.9 | ~17.7 | ~16.0 |
| Russell 2000 | ~23.7 | ~26.7 | ~26.1 | ~23.9 |
| Russell 2000 Growth | ~39.5 | ~35.9 | ~37.1 | ~35.1 |
| Russell 2000 Value | ~17.0 | ~20.7 | ~19.7 | ~18.0 |
| Russell Top 200 | ~20.0 | ~20.6 | ~24.1 | ~20.7 |
| Russell Midcap | ~16.9 | ~17.8 | ~18.6 | ~17.8 |
This dynamic was particularly visible within large-cap growth stocks. Although many technology companies continued to deliver strong earnings momentum, valuations moderated as investors demanded greater compensation for duration risk in a higher-rate environment. Interestingly, this pattern was less evident within small-cap growth equities, where valuation compression was more pronounced in value segments, highlighting the differing composition and economic sensitivities of the two universes.
From an investor perspective, the valuation reset may ultimately prove constructive. Current multiples remain broadly consistent with longer-term averages rather than indicating a broad market dislocation. For investors who have become concerned about stretched valuations following several years of strong market gains, recent pullbacks provide evidence that excess optimism has begun to unwind. Importantly, this adjustment has occurred primarily through stronger earnings growth and modest multiple compression rather than through a severe decline in equity prices. As a result, the market enters the final quarter of the year with valuations that appear healthier, while still retaining support from a relatively resilient earnings outlook.


Disclaimer
© [2026] London Stock Exchange Group plc and its applicable group undertakings (“LSEG”). LSEG includes (1) FTSE International Limited (“FTSE”), (2) Frank Russell Company (“Russell”), (3) FTSE Global Debt Capital Markets Inc. “FTSE Canada”, (4) FTSE Fixed Income LLC (“FTSE FI”), (5) FTSE (Beijing) Consulting Limited (“WOFE”), (6) FTSE EU SAS ("FES"). All rights reserved.
FTSE Russell® is a trading name of FTSE, Russell, FTSE Canada, FTSE FI, WOFE, FTSE EU and other LSEG entities providing LSEG Benchmark and Index services. “FTSE®”, “Russell®”, “FTSE Russell®”, “FTSE4Good®”, “ICB®”, “Refinitiv”, “WMR™” “FR™” and all other trademarks and service marks used herein (whether registered or unregistered) are trademarks and/or service marks owned or licensed by the applicable member of LSEG or their respective licensors.
FTSE International Limited is authorised as a Benchmark Administrator and regulated in the United Kingdom (UK) by the Financial Conduct Authority ("FCA") according to the UK Benchmark Regulation, FCA Reference Number 796803. FTSE EU SAS is authorised as Benchmark Administrator and regulated in the European Union (EU) by the Autorité des Marches Financiers (“AMF”) according to the EU Benchmark Regulation.
All information is provided for information purposes only. All information and data contained in this publication is obtained by LSEG, from sources believed by it to be accurate and reliable. Because of the possibility of human and mechanical inaccuracy as well as other factors, however, such information and data is provided "as is" without warranty of any kind. No member of LSEG nor their respective directors, officers, employees, partners or licensors make any claim, prediction, warranty or representation whatsoever, expressly or impliedly, either as to the accuracy, timeliness, completeness, merchantability of any information or LSEG Products, or of results to be obtained from the use of LSEG products, including but not limited to indices, rates, data and analytics, or the fitness or suitability of the LSEG products for any particular purpose to which they might be put. The user of the information assumes the entire risk of any use it may make or permit to be made of the information.
No responsibility or liability can be accepted by any member of LSEG nor their respective directors, officers, employees, partners or licensors for (a) any loss or damage in whole or in part caused by, resulting from, or relating to any inaccuracy (negligent or otherwise) or other circumstance involved in procuring, collecting, compiling, interpreting, analysing, editing, transcribing, transmitting, communicating or delivering any such information or data or from use of this document or links to this document or (b) any direct, indirect, special, consequential or incidental damages whatsoever, even if any member of LSEG is advised in advance of the possibility of such damages, resulting from the use of, or inability to use, such information.
No member of LSEG nor their respective directors, officers, employees, partners or licensors provide investment advice and nothing in this document should be taken as constituting financial or investment advice. No member of LSEG nor their respective directors, officers, employees, partners or licensors make any representation regarding the advisability of investing in any asset or whether such investment creates any legal or compliance risks for the investor. A decision to invest in any such asset should not be made in reliance on any information herein. Indices and rates cannot be invested in directly. Inclusion of an asset in an index or rate is not a recommendation to buy, sell or hold that asset nor confirmation that any particular investor may lawfully buy, sell or hold the asset or an index or rate containing the asset. The general information contained in this publication should not be acted upon without obtaining specific legal, tax, and investment advice from a licensed professional.
Past performance is no guarantee of future results. Charts and graphs are provided for illustrative purposes only. Index and/or rate returns shown may not represent the results of the actual trading of investable assets. Certain returns shown may reflect back-tested performance. All performance presented prior to the index or rate inception date is back-tested performance. Back-tested performance is not actual performance, but is hypothetical. The back-test calculations are based on the same methodology that was in effect when the index or rate was officially launched. However, back-tested data may reflect the application of the index or rate methodology with the benefit of hindsight, and the historic calculations of an index or rate may change from month to month based on revisions to the underlying economic data used in the calculation of the index or rate.
This document may contain forward-looking assessments. These are based upon a number of assumptions concerning future conditions that ultimately may prove to be inaccurate. Such forward-looking assessments are subject to risks and uncertainties and may be affected by various factors that may cause actual results to differ materially. No member of LSEG nor their licensors assume any duty to and do not undertake to update forward-looking assessments.
No part of this information may be reproduced, stored in a retrieval system or transmitted in any form or by any means, electronic, mechanical, photocopying, recording or otherwise, without prior written permission of the applicable member of LSEG. Use and distribution of LSEG data requires a licence from LSEG and/or its licensors.