

Robin Marshall, M.A., M.Phil

Joshua Gorelik
Assessing the value of tilting index weights by decomposing bond returns
In this short note, we extend this analysis to look at the decomposition of local sovereign bond returns between carry/income and principal returns, using data from the FTSE World Government Bond index (FTSE WGBI) since 2000. By looking at the empirical data on underlying local currency returns, we are able to assess the potential benefits of including an index tilt towards carry in FTSE Russell bond indices. We are also able to assess the value of including constraints on duration. Without constraints, unintended duration bets can arise from maximising weights in longer-dated maturities due to higher carry and upward-sloping yield curves.
Yield regimes in which principal effects from yield changes dominate returns tend to be lower-yield periods, particularly over short investment horizons. This broadly describes the recent era of near-zero interest rates, during which carry and income contributed less to returns (since bond coupons and running yields were exceptionally low and central bank Quantitative Easing (QE) programmes exacerbated these effects). Government debt management agencies also took advantage of low term premia and relatively flat yield curves to skew issuance towards long-dated debt, increasing the duration of benchmark indices, like the FTSE WGBI. But even in that era, carry returns matched or exceeded principal returns (see Table 1 below).
Price, or duration effects on returns tend to average out near zero in the longer run
Charts 1-3 show the tendency of price effects or principal returns to average out near zero in the longer run. Indeed, the average monthly returns on principal on the different maturity indexes show this in Table 1 (and were near zero). Principal returns have trended lower since interest rates rose sharply in 2022-23. The charts and Table 1 also show the higher standard deviation of principal returns relative to carry (income effects), and how the contribution of carry to WGBI returns declined in the era of zero rates. The higher duration of the 20 + yr index drove the higher standard deviation of principal returns, while the fixed coupon reduced the standard deviation of carry (or income).
Chart 1: WGBI 1-3 yr index decomposition of returns*
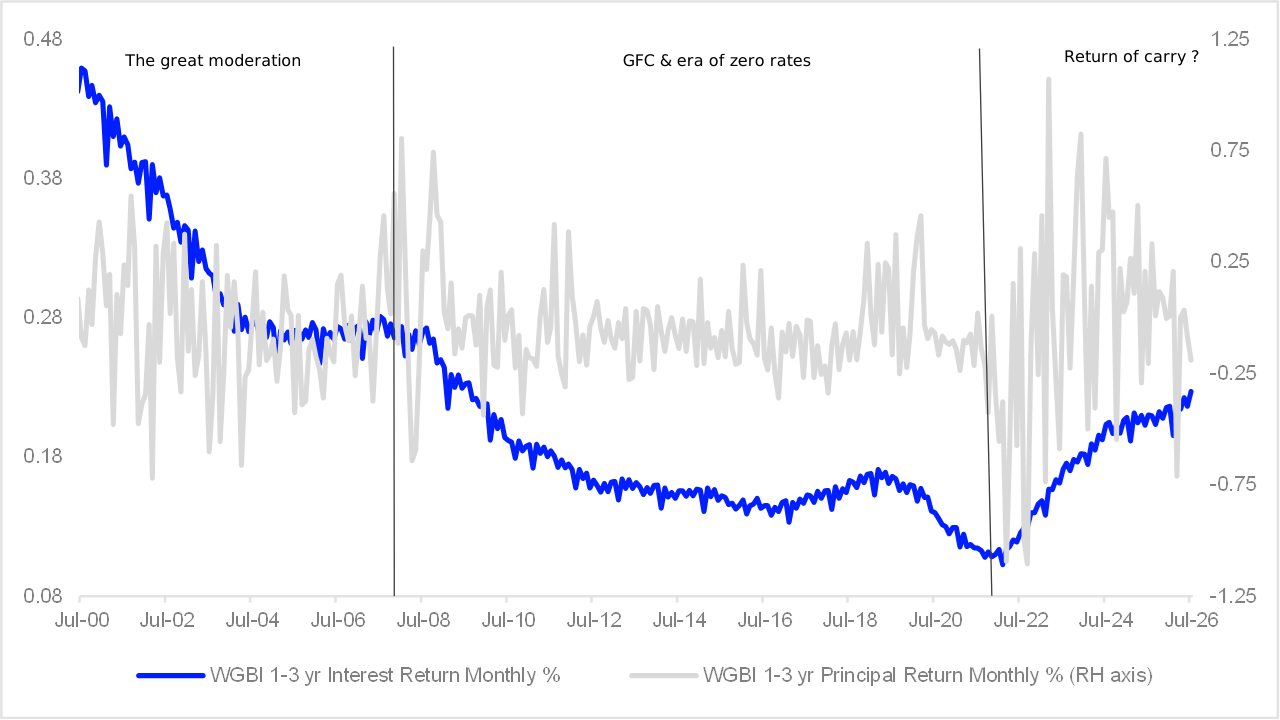
*Please note these are local currency returns, and interest returns include carry and roll-down.
Source: FTSE Russell Yield Book Monthly data, July 2000 to July 2026. Past performance is not a guide to future returns. Please see the end for important legal disclosures.
Chart 2: WGBI 7-10 yr index decomposition of returns*
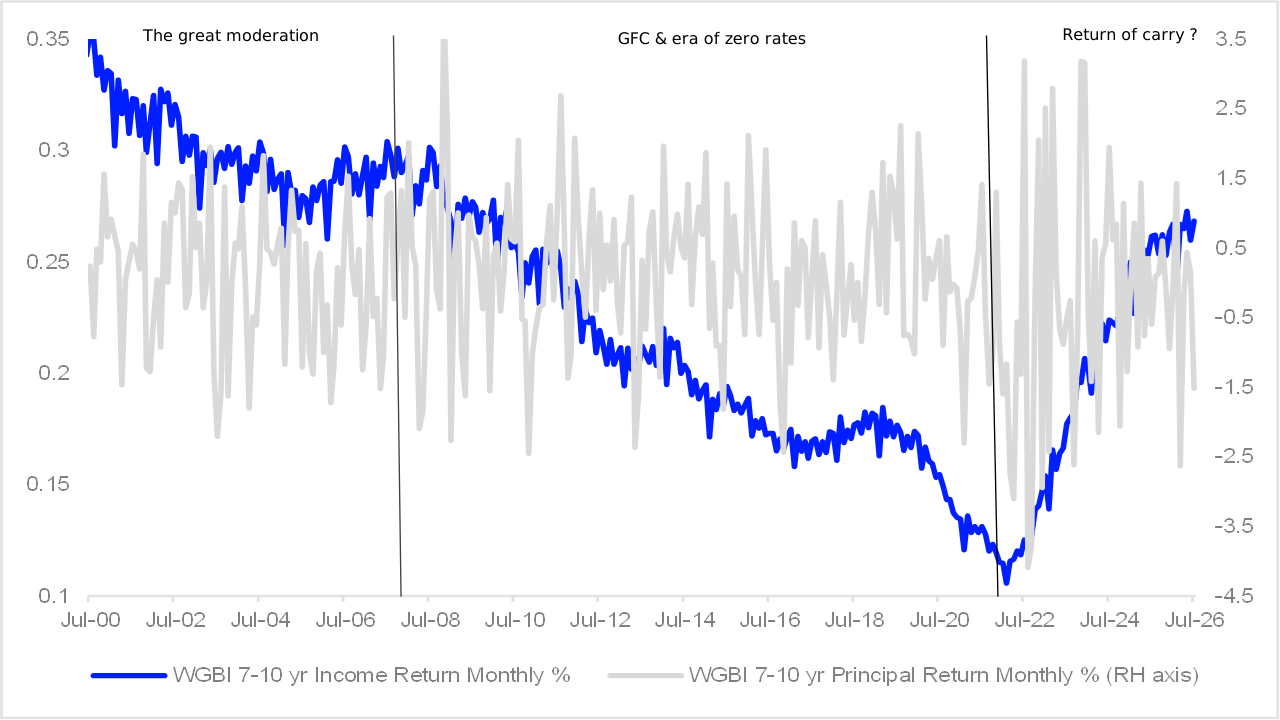
*Please note these are local currency returns and interest returns include carry and roll-down.
Source: FTSE Russell Yield Book Monthly data, July 2000 – July 2026. Past performance is not a guide to future returns. Please see the end for important legal disclosures.
Chart 3: WGBI 20 yr+ index decomposition of returns
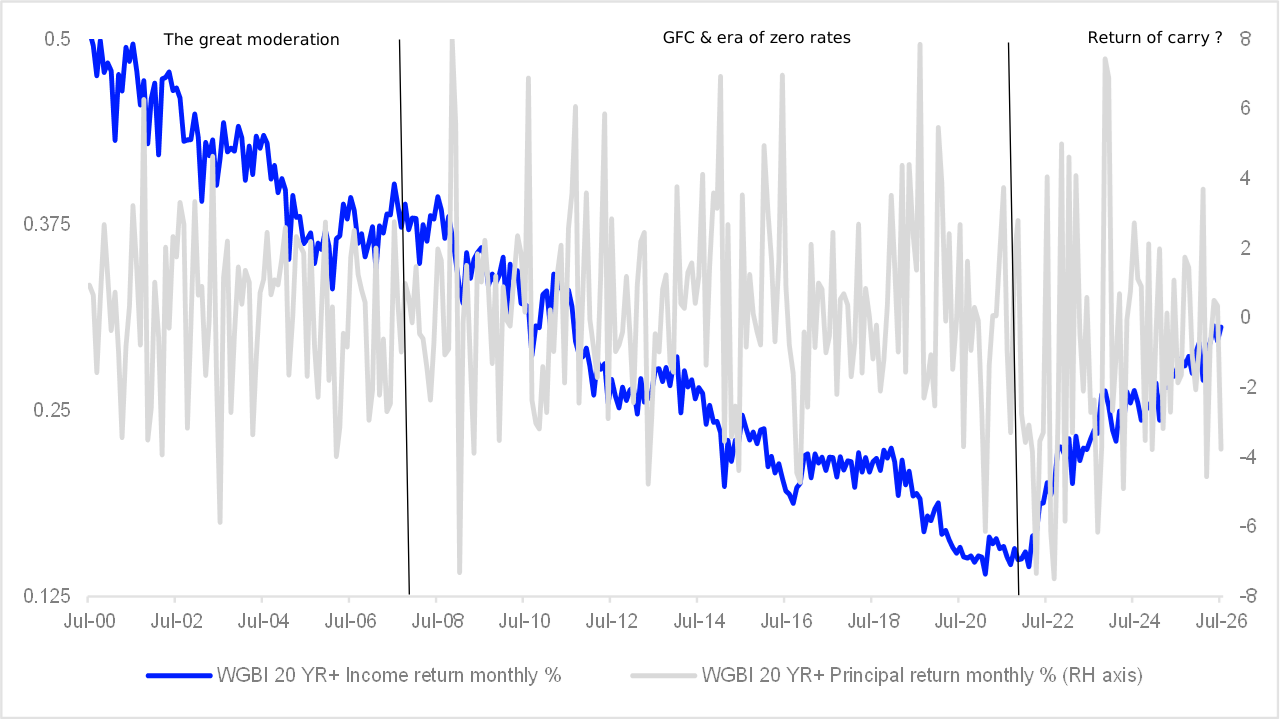
*Please note these are local currency returns and interest returns include carry and roll-down.
Source: FTSE Russell Yield Book data, July 2000- July 2026. Past performance is not a guide to future returns. Please see the end for important legal disclosures.
Major central bank policy adjustments can be used as guide to regime changes
We accept that regime changes are not defined by one indicator alone. However, sizeable central bank policy adjustments are often a useful guide. Thus the regimes shown in the charts (and used for the calculation of returns in Table 1) are based on the assumption that the Great Moderation era ended in January 2008, when the Federal Reserve cut rates by a total of 125 basis points (bp) in recognition of worsening credit market conditions and in anticipation of the great financial crisis and recession that began in Q4, 2007. By the end of 2008, the Fed had cut its target Fed funds rate to 0-0.25%, ushering in a period of near-zero rates in much of the G7. Similarly, the Fed first raised rates after Covid in March 2022, en route to a Fed Funds rate of above 5% in July 2023.
As well as the tendency of principal returns to average out near zero in the longer run, Table 1 shows the higher standard deviation of principal returns, most notably in the 20 yr+ index, reflecting the extra duration. It also shows the outperformance of carry and roll-down in all three yield regimes since 2000.
Table 1: Average monthly (local) returns* on WGBI 1-3 yr, 7-10 yr, & 20 yr + indexes
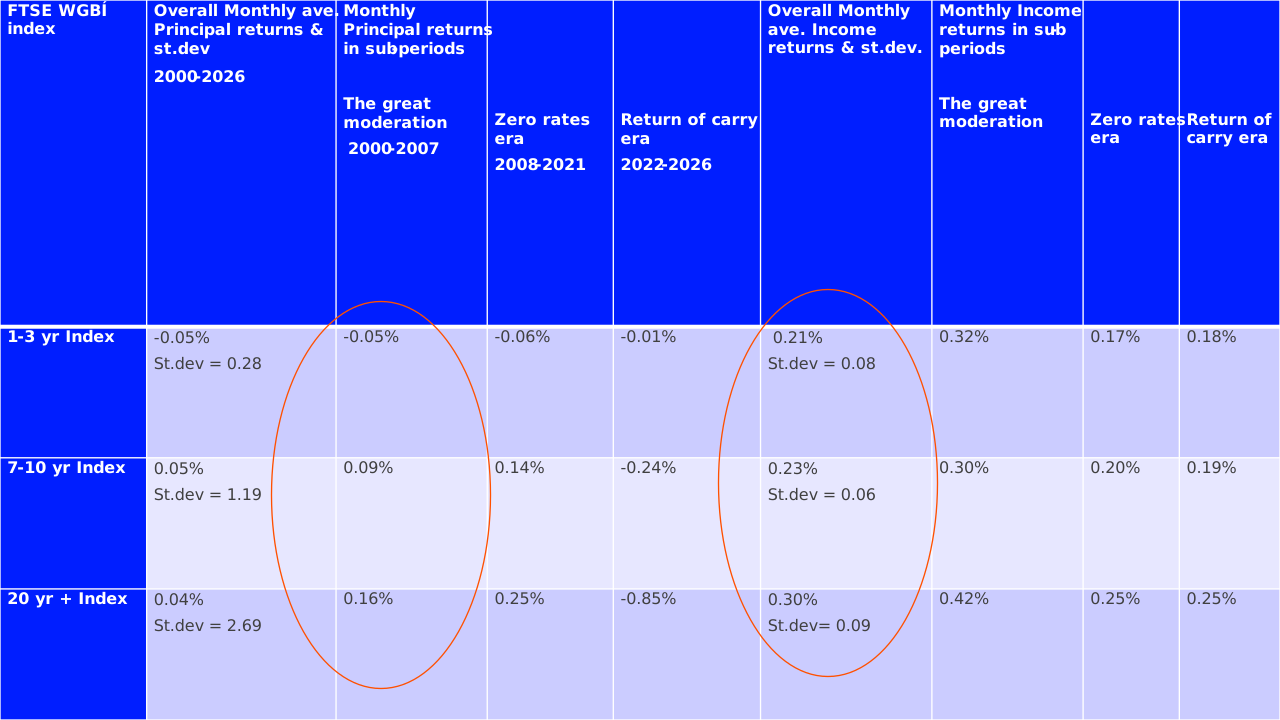
*Please note these are local currency WGBI returns and interest returns include carry and roll-down.
Source: FTSE Russell Yield book monthly data, 2000-26. Past performance is not a guide to future returns. Please see the end for important legal disclosures.
Mean reversion in yields may explain why price effects wash out near zero since 2000
The “averaging out” effect in principal returns may be evidence of mean reversion [note2] in govt bond yields since 2000 (even if, measured since 1980, yields have been in a longer-term downtrend). The impact of this mean reversion in yields since 2000 has been that exceptionally low yields tend to rise, and high yields tend to fall. This means that duration or bond price effects tend to wash out (average out near zero) over longer return horizons, and be overpowered by carry and roll-down in the breakdown of returns. Chart 4 shows US Treasury 2-year, 10-year and 30-year yields since 2000, together with the mean yields for each maturity.
Chart 4: US Treasury yields since 2000
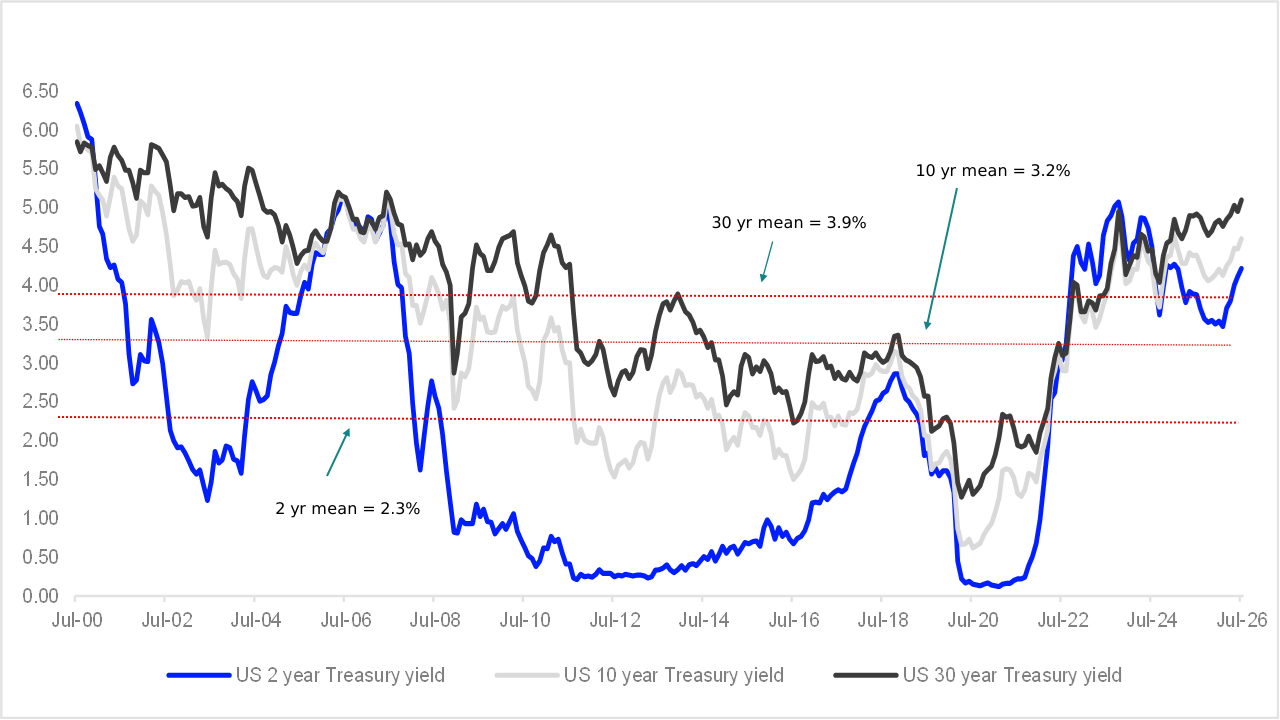
Source: US Federal Reserve Economic Data, July 2000- July 2026. Past performance is not a guide to future returns. Please see the end for important legal disclosures.
Even with higher yield ranges, carry & roll-down would likely remain key return drivers
It is notable from Chart 4 that current US Treasury yields stand well above longer-term means (measured since 2000). However, mean reversion in yields is not mechanical within a specific time frame (and is quite distinct from the pull-to-par effect in a single bond_. Indeed, the possibility exists of a new regime of higher equilibrium yields, given increased government debt issuance, higher term premia and the persistence of above-target inflation in some G7 economies. However, should that be the case and yield curves become steeper (with higher term premia, carry and roll-down effects), the yield curve would still tend to be the main driver of government bond returns. This would enhance the attractiveness of fixed income indices built with (and tilted towards) a strong carry and roll-down component.
FTSE Carry Tilt index series designed to prevent unintended duration & country bets
Without filters, however, the unconstrained maximisation of carry would run the risk of some unintended consequences in government bond index weights. Firstly, there can be unplanned duration bets from maximising carry without constraints, since under an upward-sloping yield curve this policy can tilt index weights heavily towards long-dated bonds. Secondly, within the FTSE WGBI, if country weights were driven by carry alone (i.e., without controls or constraints), this might result in an unintended decline in index credit quality as WGBI weights are increased for higher-yielding countries with lower credit ratings.
To prevent these consequences, the FTSE Carry Tilt version of the WGBI limits the weights of the maturity term sectors within which carry is maximised, as well as limiting country weights. In back-tests, we find that the FTSE CarryTilt Government Bond Index [note3], with weights tilted to enhance carry at regular rebalance dates, but subject to constraints, has outperformed base index versions.

Sources
[1] What a carry-on: starting yields as a valuation tool for sovereign bonds | LSEG, June 2026. | Back to Note 1
[2] A random or stochastic process is mean reverting if deviations from its long-run mean tend to decay over time. | Back to Note 2
[3] FTSE Carry Tilt Government Bond Index Series | LSEG | Back to Note 3

Disclaimer
© [2026] London Stock Exchange Group plc and its applicable group undertakings (“LSEG”). LSEG includes (1) FTSE International Limited (“FTSE”), (2) Frank Russell Company (“Russell”), (3) FTSE Global Debt Capital Markets Inc. “FTSE Canada”, (4) FTSE Fixed Income LLC (“FTSE FI”), (5) FTSE (Beijing) Consulting Limited (“WOFE”), (6) FTSE EU SAS ("FES"). All rights reserved.
FTSE Russell® is a trading name of FTSE, Russell, FTSE Canada, FTSE FI, WOFE, FTSE EU and other LSEG entities providing LSEG Benchmark and Index services. “FTSE®”, “Russell®”, “FTSE Russell®”, “FTSE4Good®”, “ICB®”, “Refinitiv”, “WMR™” “FR™” and all other trademarks and service marks used herein (whether registered or unregistered) are trademarks and/or service marks owned or licensed by the applicable member of LSEG or their respective licensors.
FTSE International Limited is authorised as a Benchmark Administrator and regulated in the United Kingdom (UK) by the Financial Conduct Authority ("FCA") according to the UK Benchmark Regulation, FCA Reference Number 796803. FTSE EU SAS is authorised as Benchmark Administrator and regulated in the European Union (EU) by the Autorité des Marches Financiers (“AMF”) according to the EU Benchmark Regulation.
All information is provided for information purposes only. All information and data contained in this publication is obtained by LSEG, from sources believed by it to be accurate and reliable. Because of the possibility of human and mechanical inaccuracy as well as other factors, however, such information and data is provided "as is" without warranty of any kind. No member of LSEG nor their respective directors, officers, employees, partners or licensors make any claim, prediction, warranty or representation whatsoever, expressly or impliedly, either as to the accuracy, timeliness, completeness, merchantability of any information or LSEG Products, or of results to be obtained from the use of LSEG products, including but not limited to indices, rates, data and analytics, or the fitness or suitability of the LSEG products for any particular purpose to which they might be put. The user of the information assumes the entire risk of any use it may make or permit to be made of the information.
No responsibility or liability can be accepted by any member of LSEG nor their respective directors, officers, employees, partners or licensors for (a) any loss or damage in whole or in part caused by, resulting from, or relating to any inaccuracy (negligent or otherwise) or other circumstance involved in procuring, collecting, compiling, interpreting, analysing, editing, transcribing, transmitting, communicating or delivering any such information or data or from use of this document or links to this document or (b) any direct, indirect, special, consequential or incidental damages whatsoever, even if any member of LSEG is advised in advance of the possibility of such damages, resulting from the use of, or inability to use, such information.
No member of LSEG nor their respective directors, officers, employees, partners or licensors provide investment advice and nothing in this document should be taken as constituting financial or investment advice. No member of LSEG nor their respective directors, officers, employees, partners or licensors make any representation regarding the advisability of investing in any asset or whether such investment creates any legal or compliance risks for the investor. A decision to invest in any such asset should not be made in reliance on any information herein. Indices and rates cannot be invested in directly. Inclusion of an asset in an index or rate is not a recommendation to buy, sell or hold that asset nor confirmation that any particular investor may lawfully buy, sell or hold the asset or an index or rate containing the asset. The general information contained in this publication should not be acted upon without obtaining specific legal, tax, and investment advice from a licensed professional.
Past performance is no guarantee of future results. Charts and graphs are provided for illustrative purposes only. Index and/or rate returns shown may not represent the results of the actual trading of investable assets. Certain returns shown may reflect back-tested performance. All performance presented prior to the index or rate inception date is back-tested performance. Back-tested performance is not actual performance, but is hypothetical. The back-test calculations are based on the same methodology that was in effect when the index or rate was officially launched. However, back-tested data may reflect the application of the index or rate methodology with the benefit of hindsight, and the historic calculations of an index or rate may change from month to month based on revisions to the underlying economic data used in the calculation of the index or rate.
This document may contain forward-looking assessments. These are based upon a number of assumptions concerning future conditions that ultimately may prove to be inaccurate. Such forward-looking assessments are subject to risks and uncertainties and may be affected by various factors that may cause actual results to differ materially. No member of LSEG nor their licensors assume any duty to and do not undertake to update forward-looking assessments.
No part of this information may be reproduced, stored in a retrieval system or transmitted in any form or by any means, electronic, mechanical, photocopying, recording or otherwise, without prior written permission of the applicable member of LSEG. Use and distribution of LSEG data requires a licence from LSEG and/or its licensors.