

Matt Monach, CFA,
Profitability and earnings quality can diverge dramatically during periods of market and technological transition. The current AI build-out makes that distinction especially relevant.
Quality is an interesting factor. Investors commonly associate it with businesses that are solid, stable and durable in terms of earnings and financial strength. Yet it is probably the factor with the widest range of opinions on how those characteristics should be expressed through financial ratios in practice.
At FTSE Russell, we define Quality as a combination of profitability and leverage measures: return on assets (ROA), change in asset turnover, accruals and operating cash flow relative to total debt. The rationale is straightforward. A company should not only generate attractive earnings; those earnings should also be sustainable, supported by a strong balance sheet and underpinned by high-quality revenues. Each component asks a different question: How profitable is the company? Is asset efficiency improving? How is the balance sheet evolving? How well is debt covered by operating cash flow?
Recently, we observed something in the current market that illustrates this framework particularly well.
Technology companies have generated exceptional profitability for many years, with industry-leading ROA and strong cash positions. As a result, they have historically scored highly on the Quality factor. However, this picture has begun to change. Recently, Quality factor returns have deteriorated, prompting an examination of what is happening beneath the surface.
The most profitable industry now has the highest accruals
For nearly two decades, Technology's capitalisation-weighted ROA remained well above that of every other industry, as shown in Figure 1. Technology companies have consistently delivered exceptional profitability.
Figure 1. ROA z-score by industry
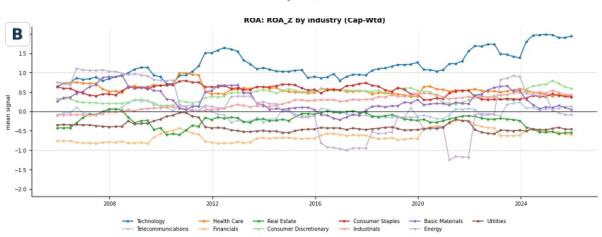
Source: FTSE Russell calculations. FTSE Developed universe, 2006-2025. Industry signals are capitalisation-weighted averages of security-level z-scores.
| Industry | ROA_Z Signal (Latest) |
|---|---|
| Technology | 1.90 |
| Health Care | 0.45 |
| Real Estate | -0.55 |
| Consumer Discretionary | 0.65 |
| Consumer Staples | 0.40 |
| Industrials | 0.35 |
| Telecommunications | 0.10 |
| Financials | -0.55 |
| Basic Materials | 0.10 |
| Energy | 0.00 |
| Utilities | -0.45 |
Technology industry accruals, however, have been considerably more volatile. As shown in Figure 2, accruals have recently risen well above their historical average relative to other industries. Higher accruals mean that reported earnings are accompanied by a larger increase in net operating or financial assets relative to cash generation. This may reflect working-capital movements, investment in long-lived operating assets, acquisitions, financial-asset changes or accounting judgements. It can be, but is not necessarily, evidence of poor creditor management or low-quality earnings.
Figure 2. Capitalisation-weighted industry accruals z-scores
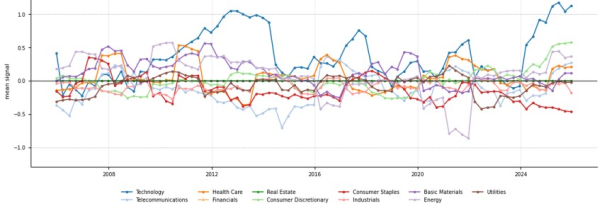
Source: FTSE Russell calculations. FTSE Developed universe, 2006-2025. Raw direction shown: higher = higher accruals. Past performance is no guarantee of future results.
| Industry | Mean Signal (Latest) |
|---|---|
| Technology | 1.10 |
| Consumer Discretionary | 0.55 |
| Energy | 0.40 |
| Basic Materials | 0.35 |
| Telecommunications | 0.25 |
| Health Care | 0.20 |
| Financials | 0.15 |
| Real Estate | 0.05 |
| Utilities | 0.00 |
| Industrials | -0.15 |
| Consumer Staples | -0.45 |
It is important to note that these industry-level measures are capitalisation-weighted. This matters for passive investors because a small number of very large companies can meaningfully influence the industry characteristics within an index. In the case of Technology, several of the largest companies combine high reported profitability with elevated accruals. High accruals signal a widening gap between profits and cash generation. That can reflect weaker cash conversion and lower earnings quality, but also investment in long-lived assets, including AI infrastructure. As a result, passive investors may inherit these characteristics in their portfolios without making an explicit investment decision to do so.
As Figure 3 shows, the dispersion of accruals within Technology is quite wide. The median company sits much closer to the average across the broader developed-market universe.
Figure 3. Dispersion of accruals in the Technology industry

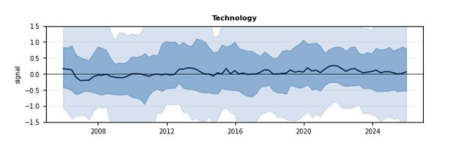
Source: FTSE Russell calculations. FTSE Developed universe, 2006-2025. Higher raw accruals indicate weaker earnings quality, when all else is equal.
| Year | Technology Signal |
|---|---|
| 2006 | 0.20 |
| 2008 | -0.15 |
| 2010 | 0.00 |
| 2012 | 0.18 |
| 2014 | 0.02 |
| 2016 | 0.05 |
| 2018 | 0.08 |
| 2020 | 0.10 |
| 2022 | 0.22 |
| 2024 | 0.05 |
| 2025 | 0.02 |
The largest-capitalisation stocks are therefore responsible for a substantial share of the industry’s elevated accruals profile. To illustrate this point, we grouped companies into ten accrual deciles and calculated the market-capitalisation weight represented by each decile over time (Figure 4).
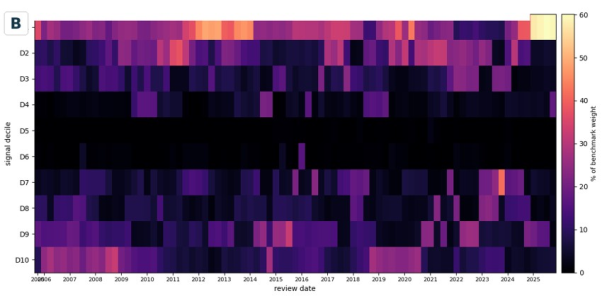
Source: FTSE Russell calculations. FTSE Developed universe, 2006-2025. Decile shares are measured using benchmark capitalisation weights.
| Signal Decile | Benchmark Weight (%) |
|---|---|
D1 |
59% |
D2 |
5% |
D3 |
4% |
D4 |
18% |
D5 |
0% |
D6 |
0% |
D7 |
3% |
D8 |
4% |
D9 |
2% |
D10 |
6% |
The concentration is striking. Within Technology, the highest-accrual decile accounts for more than 60% of total industry weight.
This does not mean that 60% of Technology companies have weak earnings quality. Rather, it means that companies representing more than 60% of the industry’s market capitalisation fall into the highest-accrual decile. That is a concentration effect, not a breadth effect, and it highlights how stock counts and benchmark weights can tell very different stories.
Interestingly, a similar pattern emerged during 2012–2014, when the highest-accrual decile accounted for roughly 50% of industry capitalisation.
2012–2014: A similar pattern
What followed was not particularly favourable for the industry from a factor perspective.
Companies with the highest ROA, many of which were Technology stocks, delivered strong performance leading up to 2012. Thereafter, their relative performance weakened. At the same time, companies with low accruals, many outside the Technology sector, were comparatively weak during 2011–2012 but subsequently outperformed during 2012–2014, as shown in Figure 5.
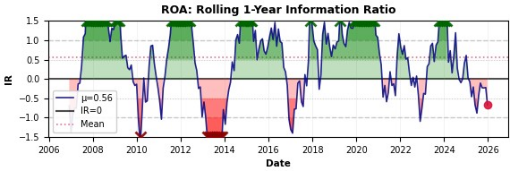
Source: FTSE Russell calculations. Fixed-tilt factor portfolios relative to the capitalisation-weighted FTSE Developed benchmark. Fixed-tilt portfolios retain their associated country, industry and style exposures; the results are not pure factor returns.
| Year | Rolling 1-Year Information Ratio |
|---|---|
| 2006 | 0.1 |
| 2008 | 1.4 |
| 2010 | -1.4 |
| 2012 | 1.5 |
| 2014 | -1.5 |
| 2016 | 1.0 |
| 2018 | 1.2 |
| 2020 | 1.4 |
| 2022 | -0.8 |
| 2024 | 1.1 |
| 2025 | 0.0 |
| 2026 | -0.7 |
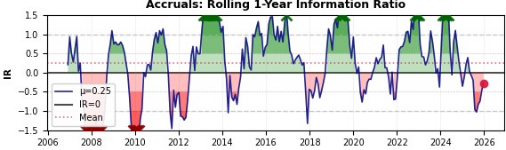
Source: FTSE Russell calculations. Fixed-tilt factor portfolios relative to the capitalisation-weighted FTSE Developed benchmark. Fixed-tilt portfolios retain their associated country, industry and style exposures; the results are not pure factor returns.
| Year | Rolling 1-Year Information Ratio |
|---|---|
| 2007 | 0.9 |
| 2008 | -1.4 |
| 2010 | -1.5 |
| 2012 | 1.4 |
| 2014 | -0.8 |
| 2016 | 1.0 |
| 2018 | -1.2 |
| 2020 | 1.3 |
| 2022 | -0.6 |
| 2023 | 1.1 |
| 2024 | 0.2 |
| 2025 | -0.9 |
| 2026 | -0.3 |
The AI cycle: a rhyme, not a forecast
As the old saying goes, “History doesn’t repeat itself, but it often rhymes.” None of this implies that the Technology industry will necessarily underperform in the coming years because of deteriorating Accrual scores. Past performance is not indicative of future results.
It does, however, highlight a potential risk worth monitoring.
The broader economic and market backdrop changed materially during the previous episode. Euro-area tail risks receded, monetary policy supported risk appetite, and investors shifted their focus from crisis resilience towards recovery and future growth. Within Technology, mobile computing, cloud infrastructure and platform business models were displacing the economics of the PC era. Those developments provide plausible context for the divergence observed at the time, but they do not establish causality.
Today is not a replay of that period. Recent one-year factor readings are negative for both profitability and accrual signals, while three-year readings differ only modestly. The lesson from 2012–2014 is a narrow one: during periods of transition, markets can value current profitability and earnings quality differently.
The current AI investment cycle makes this distinction especially relevant. Technology companies are committing substantial capital to infrastructure whose ultimate returns are still being established, even as current profitability remains exceptional. Our evidence does not attribute factor performance to AI. Rather, it shows that profitability and accrual characteristics have diverged during a capital-intensive phase of technological transformation.
The parallel with 2012–2014 is therefore a question rather than an answer: how should investors weigh exceptional current profitability against the capital required to secure future growth?
The differences are important. Investors in 2012 were navigating a post-crisis recovery alongside the transition from PC-centric business models to mobile, cloud and platform ecosystems. Today’s leading AI investors are predominantly highly profitable incumbents rather than emerging challengers, and the monetary environment is very different. The rhyme lies in the tension between current returns and the investment required to secure future growth, not in any prediction that the same return patterns will follow.
The FTSE Russell Quality framework is designed precisely for this type of challenge. It combines ROA, change in asset turnover and accruals into a profitability assessment, which is then complemented by a leverage measure based on operating cash flow relative to debt. When one component reaches an extreme, the others provide context and balance.
When profits run ahead of cash, the key question is not which measure is “correct”. The more important questions are why the two measures disagree, how concentrated the disagreement is and whether the conclusion remains robust under a broader definition of Quality.
The historical comparison is not a timing signal on Technology or AI. It is a reminder that Quality is not a celebration of high profits. It is a test of whether those profits can endure.
References
- FTSE Russell (2014), Factor Exposure Indexes: Quality Factor.
- Sloan, R. (1996), The Accounting Review.
- Richardson et al. (2005), Journal of Accounting and Economics.

Read more about

Disclaimer
© [2026] London Stock Exchange Group plc and its applicable group undertakings (“LSEG”). LSEG includes (1) FTSE International Limited (“FTSE”), (2) Frank Russell Company (“Russell”), (3) FTSE Global Debt Capital Markets Inc. “FTSE Canada”, (4) FTSE Fixed Income LLC (“FTSE FI”), (5) FTSE (Beijing) Consulting Limited (“WOFE”), (6) FTSE EU SAS ("FES"). All rights reserved.
FTSE Russell® is a trading name of FTSE, Russell, FTSE Canada, FTSE FI, WOFE, FTSE EU and other LSEG entities providing LSEG Benchmark and Index services. “FTSE®”, “Russell®”, “FTSE Russell®”, “FTSE4Good®”, “ICB®”, “Refinitiv”, “WMR™” “FR™” and all other trademarks and service marks used herein (whether registered or unregistered) are trademarks and/or service marks owned or licensed by the applicable member of LSEG or their respective licensors.
FTSE International Limited is authorised as a Benchmark Administrator and regulated in the United Kingdom (UK) by the Financial Conduct Authority ("FCA") according to the UK Benchmark Regulation, FCA Reference Number 796803. FTSE EU SAS is authorised as Benchmark Administrator and regulated in the European Union (EU) by the Autorité des Marches Financiers (“AMF”) according to the EU Benchmark Regulation.
All information is provided for information purposes only. All information and data contained in this publication is obtained by LSEG, from sources believed by it to be accurate and reliable. Because of the possibility of human and mechanical inaccuracy as well as other factors, however, such information and data is provided "as is" without warranty of any kind. No member of LSEG nor their respective directors, officers, employees, partners or licensors make any claim, prediction, warranty or representation whatsoever, expressly or impliedly, either as to the accuracy, timeliness, completeness, merchantability of any information or LSEG Products, or of results to be obtained from the use of LSEG products, including but not limited to indices, rates, data and analytics, or the fitness or suitability of the LSEG products for any particular purpose to which they might be put. The user of the information assumes the entire risk of any use it may make or permit to be made of the information.
No responsibility or liability can be accepted by any member of LSEG nor their respective directors, officers, employees, partners or licensors for (a) any loss or damage in whole or in part caused by, resulting from, or relating to any inaccuracy (negligent or otherwise) or other circumstance involved in procuring, collecting, compiling, interpreting, analysing, editing, transcribing, transmitting, communicating or delivering any such information or data or from use of this document or links to this document or (b) any direct, indirect, special, consequential or incidental damages whatsoever, even if any member of LSEG is advised in advance of the possibility of such damages, resulting from the use of, or inability to use, such information.
No member of LSEG nor their respective directors, officers, employees, partners or licensors provide investment advice and nothing in this document should be taken as constituting financial or investment advice. No member of LSEG nor their respective directors, officers, employees, partners or licensors make any representation regarding the advisability of investing in any asset or whether such investment creates any legal or compliance risks for the investor. A decision to invest in any such asset should not be made in reliance on any information herein. Indices and rates cannot be invested in directly. Inclusion of an asset in an index or rate is not a recommendation to buy, sell or hold that asset nor confirmation that any particular investor may lawfully buy, sell or hold the asset or an index or rate containing the asset. The general information contained in this publication should not be acted upon without obtaining specific legal, tax, and investment advice from a licensed professional.
Past performance is no guarantee of future results. Charts and graphs are provided for illustrative purposes only. Index and/or rate returns shown may not represent the results of the actual trading of investable assets. Certain returns shown may reflect back-tested performance. All performance presented prior to the index or rate inception date is back-tested performance. Back-tested performance is not actual performance, but is hypothetical. The back-test calculations are based on the same methodology that was in effect when the index or rate was officially launched. However, back-tested data may reflect the application of the index or rate methodology with the benefit of hindsight, and the historic calculations of an index or rate may change from month to month based on revisions to the underlying economic data used in the calculation of the index or rate.
This document may contain forward-looking assessments. These are based upon a number of assumptions concerning future conditions that ultimately may prove to be inaccurate. Such forward-looking assessments are subject to risks and uncertainties and may be affected by various factors that may cause actual results to differ materially. No member of LSEG nor their licensors assume any duty to and do not undertake to update forward-looking assessments.
No part of this information may be reproduced, stored in a retrieval system or transmitted in any form or by any means, electronic, mechanical, photocopying, recording or otherwise, without prior written permission of the applicable member of LSEG. Use and distribution of LSEG data requires a licence from LSEG and/or its licensors.