

Owen Lund
In 2015, Nvidia was around the 800th-largest company in the world. Less than a decade later, it was number one.
It is a striking ascent, but Nvidia is only the latest name in a long history of changing leadership in the global equity markets. From General Electric, Toyota and Exxon Mobil to Apple and Microsoft, the identity of the world’s largest listed company has changed repeatedly over the past few decades.
And those changes have not happened at a steady pace.
When leadership changes hand
Much like the role of UK prime minister, equity market leadership tends to alternate between long periods of stability and short bursts of intense change.
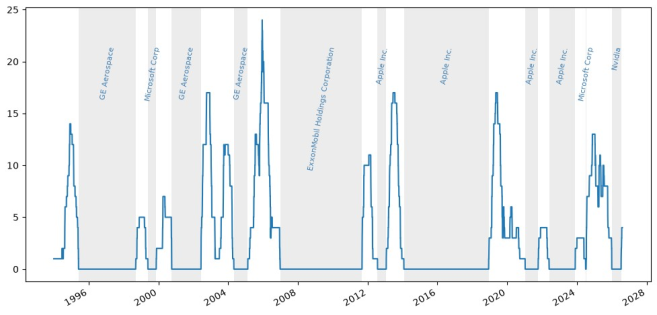
In Figure 1, we show the number of leadership changes in the FTSE All-World Index over a trailing six-month window. The periods shaded grey are those where one company sits at the top of the size rankings, while those shaded white denote leadership change.
Figure 1: Number of leadership changes in FTSE All-World Index over trailing six-month window
Source: FTSE Russell, data from 31/12/1993-11/8/2026. Data before the index inception date (30/6/2000) is based on a back-test of the index rules. Past performance is not a guide to future returns.
The mid-2000s contest between General Electric, now GE Aerospace, and Exxon Mobil produced several changes at the top of the FTSE All-World Index as the two companies’ market values converged. More recently, Apple, Microsoft and Nvidia have repeatedly exchanged the lead.
At other times, the picture has been remarkably stable, with a single company remaining at the top for years. In 1999, for example, Fortune magazine named former General Electric CEO Jack Welch “manager of the century” for having grown his company’s market value from $14 billion to $600 billion over two decades, driving it to the top of the global size rankings.
The overall picture of FTSE All-World Index leadership is a distinctive pattern: long periods of relative calm punctuated by bursts of competition for the number-one position.
The rankings tell a bigger story
Reaching number one is only part of the story. The paths companies take before and after reaching the top can be just as dramatic.
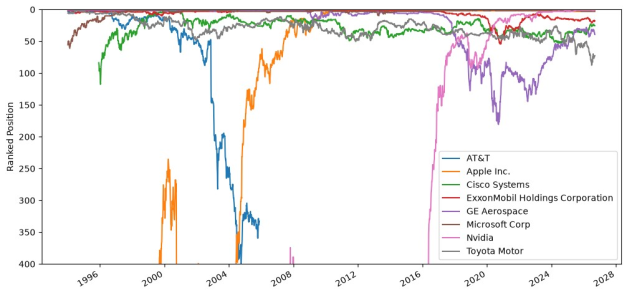
Some former leaders have gradually moved down the global rankings, while others have climbed hundreds of places on their way to the top. Nvidia’s ascent is the most striking recent example, but Figure 2 shows that substantial changes in relative company size are a recurring feature of global equity markets.
Figure 2: Ranked position of largest companies in the FTSE All-World index
Source: FTSE Russell, data from 31/12/1993-11/8/2026. Data before the index inception date (30/6/2000) is based on a back-test of the index rules. Past performance is not a guide to future returns.
AT&T sat briefly at the top of the global equity rankings in the early 1990s, before plummeting after the end of the 1999/2000 tech/telecom bubble.
Now at over $300 (in early August 2026), Apple’s share price fell as far as $0.2 in 2003 before the company recovered its fortunes with the launch of iTunes, the iPod and the iPhone. The company reached the top of the global equity size scale by the early 2010s.
Reaching the top and staying there are two very different things. Some companies have dominated the number-one position for years; for others, the experience has been fleeting (see Figure 3).
Figure 3: Total days as the world’s largest listed company
| Company | Total days on the throne |
|---|---|
| Apple Inc. | 2986 |
| GE (now GE Aerospace) | 2379 |
| Exxon Mobil Corporation | 1733 |
| Microsoft Corp | 1035 |
| Nvidia | 303 |
| AT&T | 33 |
| Toyota Motor | 25 |
| Cisco Systems | 2 |
Source: FTSE Russell, data from 31/12/1993-11/8/2026. Data before the index inception date (30/6/2000) is based on a back-test of the index rules. Past performance is not a guide to future returns.
Sometimes, companies can reach the top as the result of a market anomaly. In October 2008, Volkswagen became the most valuable company in the world for just a few hours as the result of a short squeeze, temporarily replacing ExxonMobil.
You don’t have to predict the next winner
This brief historical overview shows how unstable individual companies’ fortunes can be. The changes we’ve highlighted in the global equity rankings are also much easier to identify in hindsight than to forecast. We know which companies dominate global markets today; knowing which will occupy those positions five, ten or twenty years from now is considerably harder.
Fortunately, a market capitalisation-weighted global index takes a different approach, reducing this forecasting burden.
A broad, capitalisation-weighted index such as the FTSE All-World adjusts automatically as the market changes. As the market values and size rankings of eligible companies rise and fall, their index weights change with them, subject to the index methodology.
That creates an important distinction between predicting market leadership and participating in it.
Investors do not need to identify the next global champion while it is still hundreds of places down the rankings. Nor do they need to decide when an incumbent leader’s dominance will end. A capitalisation-weighted index reflects changes in relative market value as they occur.
The next company to reach the top may already be familiar — or it may currently sit hundreds of places down the rankings. We don’t know which.
And for investors using a broad, capitalisation-weighted global index as a benchmark or as the performance target of a tracker fund, that is precisely the point.


Disclaimer
© [2026] London Stock Exchange Group plc and its applicable group undertakings (“LSEG”). LSEG includes (1) FTSE International Limited (“FTSE”), (2) Frank Russell Company (“Russell”), (3) FTSE Global Debt Capital Markets Inc. “FTSE Canada”, (4) FTSE Fixed Income LLC (“FTSE FI”), (5) FTSE (Beijing) Consulting Limited (“WOFE”), (6) FTSE EU SAS ("FES"). All rights reserved.
FTSE Russell® is a trading name of FTSE, Russell, FTSE Canada, FTSE FI, WOFE, FTSE EU and other LSEG entities providing LSEG Benchmark and Index services. “FTSE®”, “Russell®”, “FTSE Russell®”, “FTSE4Good®”, “ICB®”, “Refinitiv”, “WMR™” “FR™” and all other trademarks and service marks used herein (whether registered or unregistered) are trademarks and/or service marks owned or licensed by the applicable member of LSEG or their respective licensors.
FTSE International Limited is authorised as a Benchmark Administrator and regulated in the United Kingdom (UK) by the Financial Conduct Authority ("FCA") according to the UK Benchmark Regulation, FCA Reference Number 796803. FTSE EU SAS is authorised as Benchmark Administrator and regulated in the European Union (EU) by the Autorité des Marches Financiers (“AMF”) according to the EU Benchmark Regulation.
All information is provided for information purposes only. All information and data contained in this publication is obtained by LSEG, from sources believed by it to be accurate and reliable. Because of the possibility of human and mechanical inaccuracy as well as other factors, however, such information and data is provided "as is" without warranty of any kind. No member of LSEG nor their respective directors, officers, employees, partners or licensors make any claim, prediction, warranty or representation whatsoever, expressly or impliedly, either as to the accuracy, timeliness, completeness, merchantability of any information or LSEG Products, or of results to be obtained from the use of LSEG products, including but not limited to indices, rates, data and analytics, or the fitness or suitability of the LSEG products for any particular purpose to which they might be put. The user of the information assumes the entire risk of any use it may make or permit to be made of the information.
No responsibility or liability can be accepted by any member of LSEG nor their respective directors, officers, employees, partners or licensors for (a) any loss or damage in whole or in part caused by, resulting from, or relating to any inaccuracy (negligent or otherwise) or other circumstance involved in procuring, collecting, compiling, interpreting, analysing, editing, transcribing, transmitting, communicating or delivering any such information or data or from use of this document or links to this document or (b) any direct, indirect, special, consequential or incidental damages whatsoever, even if any member of LSEG is advised in advance of the possibility of such damages, resulting from the use of, or inability to use, such information.
No member of LSEG nor their respective directors, officers, employees, partners or licensors provide investment advice and nothing in this document should be taken as constituting financial or investment advice. No member of LSEG nor their respective directors, officers, employees, partners or licensors make any representation regarding the advisability of investing in any asset or whether such investment creates any legal or compliance risks for the investor. A decision to invest in any such asset should not be made in reliance on any information herein. Indices and rates cannot be invested in directly. Inclusion of an asset in an index or rate is not a recommendation to buy, sell or hold that asset nor confirmation that any particular investor may lawfully buy, sell or hold the asset or an index or rate containing the asset. The general information contained in this publication should not be acted upon without obtaining specific legal, tax, and investment advice from a licensed professional.
Past performance is no guarantee of future results. Charts and graphs are provided for illustrative purposes only. Index and/or rate returns shown may not represent the results of the actual trading of investable assets. Certain returns shown may reflect back-tested performance. All performance presented prior to the index or rate inception date is back-tested performance. Back-tested performance is not actual performance, but is hypothetical. The back-test calculations are based on the same methodology that was in effect when the index or rate was officially launched. However, back-tested data may reflect the application of the index or rate methodology with the benefit of hindsight, and the historic calculations of an index or rate may change from month to month based on revisions to the underlying economic data used in the calculation of the index or rate.
This document may contain forward-looking assessments. These are based upon a number of assumptions concerning future conditions that ultimately may prove to be inaccurate. Such forward-looking assessments are subject to risks and uncertainties and may be affected by various factors that may cause actual results to differ materially. No member of LSEG nor their licensors assume any duty to and do not undertake to update forward-looking assessments.
No part of this information may be reproduced, stored in a retrieval system or transmitted in any form or by any means, electronic, mechanical, photocopying, recording or otherwise, without prior written permission of the applicable member of LSEG. Use and distribution of LSEG data requires a licence from LSEG and/or its licensors.