Alex Nae, MSc.

Lee Clements
key takeaways
- El Niño has well-documented effects on food production, inflation and economic activity, but the historical relationship with country equity returns is far less consistent.
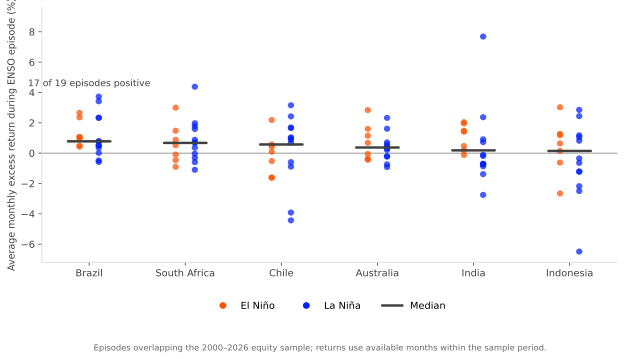
- Across six exposed countries since 2000, Brazil stands out: 17 of 19 ENSO episodes produced positive excess returns, although ENSO explains only a small share of overall return variation.
- Brazil also shows why the economic effect and the index response can diverge. Agriculture is important to the wider economy, while FTSE Brazil is dominated by Financials, Energy and Basic Materials, making ENSO more useful as a regime indicator than a standalone trading signal.
El Niño and La Niña are the warm and cool phases of the El Niño-Southern Oscillation (ENSO), a recurring change in ocean and atmospheric conditions across the tropical Pacific. These changes alter rainfall and temperature patterns well beyond the Pacific. El Niño generally raises global temperatures, while La Niña has a cooling influence. Both can alter rainfall patterns enough to bring drought or flooding depending on the region.
This spills into the real economy through agriculture, hydropower, logistics and food prices. The 2026 El Niño is now the strongest event in the observational record, with its effects expected to extend into 2027. [note1]
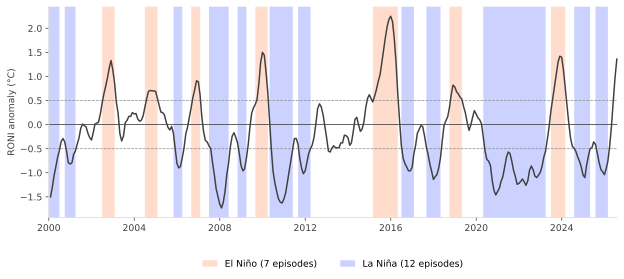
Figure 1 - El Niño and La Niña regimes since 2000
Source: NOAA Climate Prediction Center, FTSE Russell, data as of August 2026. Past performance is not a guide to future returns. Please see the end for important legal disclosures.
| Date | RONI anomaly (°C) | ENSO phase |
|---|---|---|
| Jan-00 | -1.50 | La Niña |
| Feb-00 | -1.31 | La Niña |
| Mar-00 | -1.06 | La Niña |
| Apr-00 | -0.88 | La Niña |
| May-00 | -0.68 | La Niña |
| Jun-00 | -0.54 | La Niña |
| Jul-00 | -0.35 | Neutral |
| Aug-00 | -0.29 | Neutral |
| Sep-00 | -0.36 | Neutral |
| Oct-00 | -0.55 | La Niña |
| Nov-00 | -0.79 | La Niña |
| Dec-00 | -0.82 | La Niña |
| Jan-01 | -0.79 | La Niña |
| Feb-01 | -0.62 | La Niña |
| Mar-01 | -0.55 | La Niña |
| Apr-01 | -0.41 | Neutral |
| May-01 | -0.28 | Neutral |
| Jun-01 | -0.08 | Neutral |
| Jul-01 | 0.01 | Neutral |
| Aug-01 | -0.02 | Neutral |
| Sep-01 | -0.05 | Neutral |
| Oct-01 | -0.18 | Neutral |
| Nov-01 | -0.27 | Neutral |
| Dec-01 | -0.32 | Neutral |
| Jan-02 | -0.16 | Neutral |
| Feb-02 | 0.01 | Neutral |
| Mar-02 | 0.03 | Neutral |
| Apr-02 | 0.05 | Neutral |
| May-02 | 0.22 | Neutral |
| Jun-02 | 0.44 | Neutral |
| Jul-02 | 0.64 | El Niño |
| Aug-02 | 0.80 | El Niño |
| Sep-02 | 0.97 | El Niño |
| Oct-02 | 1.18 | El Niño |
| Nov-02 | 1.33 | El Niño |
| Dec-02 | 1.13 | El Niño |
| Jan-03 | 0.85 | El Niño |
| Feb-03 | 0.47 | Neutral |
| Mar-03 | 0.23 | Neutral |
| Apr-03 | -0.19 | Neutral |
| May-03 | -0.34 | Neutral |
| Jun-03 | -0.24 | Neutral |
| Jul-03 | 0.04 | Neutral |
| Aug-03 | 0.09 | Neutral |
| Sep-03 | 0.17 | Neutral |
| Oct-03 | 0.17 | Neutral |
| Nov-03 | 0.25 | Neutral |
| Dec-03 | 0.22 | Neutral |
| Jan-04 | 0.23 | Neutral |
| Feb-04 | 0.12 | Neutral |
| Mar-04 | 0.07 | Neutral |
| Apr-04 | 0.09 | Neutral |
| May-04 | 0.18 | Neutral |
| Jun-04 | 0.36 | Neutral |
| Jul-04 | 0.54 | El Niño |
| Aug-04 | 0.69 | El Niño |
| Sep-04 | 0.71 | El Niño |
| Oct-04 | 0.70 | El Niño |
| Nov-04 | 0.70 | El Niño |
| Dec-04 | 0.69 | El Niño |
| Jan-05 | 0.54 | El Niño |
| Feb-05 | 0.40 | Neutral |
| Mar-05 | 0.26 | Neutral |
| Apr-05 | 0.25 | Neutral |
| May-05 | 0.20 | Neutral |
| Jun-05 | 0.05 | Neutral |
| Jul-05 | -0.06 | Neutral |
| Aug-05 | -0.11 | Neutral |
| Sep-05 | -0.04 | Neutral |
| Oct-05 | -0.18 | Neutral |
| Nov-05 | -0.50 | La Niña |
| Dec-05 | -0.81 | La Niña |
| Jan-06 | -0.90 | La Niña |
| Feb-06 | -0.87 | La Niña |
| Mar-06 | -0.69 | La Niña |
| Apr-06 | -0.49 | Neutral |
| May-06 | -0.19 | Neutral |
| Jun-06 | -0.05 | Neutral |
| Jul-06 | 0.15 | Neutral |
| Aug-06 | 0.36 | Neutral |
| Sep-06 | 0.57 | El Niño |
| Oct-06 | 0.73 | El Niño |
| Nov-06 | 0.91 | El Niño |
| Dec-06 | 0.89 | El Niño |
| Jan-07 | 0.60 | El Niño |
| Feb-07 | 0.16 | Neutral |
| Mar-07 | -0.15 | Neutral |
| Apr-07 | -0.33 | Neutral |
| May-07 | -0.36 | Neutral |
| Jun-07 | -0.44 | Neutral |
| Jul-07 | -0.50 | La Niña |
| Aug-07 | -0.79 | La Niña |
| Sep-07 | -1.04 | La Niña |
| Oct-07 | -1.33 | La Niña |
| Nov-07 | -1.49 | La Niña |
| Dec-07 | -1.65 | La Niña |
| Jan-08 | -1.73 | La Niña |
| Feb-08 | -1.62 | La Niña |
| Mar-08 | -1.39 | La Niña |
| Apr-08 | -1.04 | La Niña |
| May-08 | -0.80 | La Niña |
| Jun-08 | -0.46 | Neutral |
| Jul-08 | -0.24 | Neutral |
| Aug-08 | -0.17 | Neutral |
| Sep-08 | -0.26 | Neutral |
| Oct-08 | -0.38 | Neutral |
| Nov-08 | -0.60 | La Niña |
| Dec-08 | -0.86 | La Niña |
| Jan-09 | -0.96 | La Niña |
| Feb-09 | -0.92 | La Niña |
| Mar-09 | -0.70 | La Niña |
| Apr-09 | -0.43 | Neutral |
| May-09 | -0.05 | Neutral |
| Jun-09 | 0.24 | Neutral |
| Jul-09 | 0.35 | Neutral |
| Aug-09 | 0.42 | Neutral |
| Sep-09 | 0.53 | El Niño |
| Oct-09 | 0.86 | El Niño |
| Nov-09 | 1.29 | El Niño |
| Dec-09 | 1.50 | El Niño |
| Jan-10 | 1.44 | El Niño |
| Feb-10 | 1.11 | El Niño |
| Mar-10 | 0.69 | El Niño |
| Apr-10 | 0.10 | Neutral |
| May-10 | -0.50 | La Niña |
| Jun-10 | -0.97 | La Niña |
| Jul-10 | -1.21 | La Niña |
| Aug-10 | -1.39 | La Niña |
| Sep-10 | -1.54 | La Niña |
| Oct-10 | -1.61 | La Niña |
| Nov-10 | -1.63 | La Niña |
| Dec-10 | -1.55 | La Niña |
| Jan-11 | -1.42 | La Niña |
| Feb-11 | -1.21 | La Niña |
| Mar-11 | -0.97 | La Niña |
| Apr-11 | -0.76 | La Niña |
| May-11 | -0.52 | La Niña |
| Jun-11 | -0.29 | Neutral |
| Jul-11 | -0.29 | Neutral |
| Aug-11 | -0.41 | Neutral |
| Sep-11 | -0.70 | La Niña |
| Oct-11 | -0.91 | La Niña |
| Nov-11 | -1.02 | La Niña |
| Dec-11 | -0.96 | La Niña |
| Jan-12 | -0.77 | La Niña |
| Feb-12 | -0.60 | La Niña |
| Mar-12 | -0.50 | La Niña |
| Apr-12 | -0.42 | Neutral |
| May-12 | -0.26 | Neutral |
| Jun-12 | 0.01 | Neutral |
| Jul-12 | 0.33 | Neutral |
| Aug-12 | 0.43 | Neutral |
| Sep-12 | 0.37 | Neutral |
| Oct-12 | 0.21 | Neutral |
| Nov-12 | -0.03 | Neutral |
| Dec-12 | -0.27 | Neutral |
| Jan-13 | -0.55 | Neutral |
| Feb-13 | -0.57 | Neutral |
| Mar-13 | -0.49 | Neutral |
| Apr-13 | -0.44 | Neutral |
| May-13 | -0.48 | Neutral |
| Jun-13 | -0.48 | Neutral |
| Jul-13 | -0.48 | Neutral |
| Aug-13 | -0.38 | Neutral |
| Sep-13 | -0.38 | Neutral |
| Oct-13 | -0.22 | Neutral |
| Nov-13 | -0.23 | Neutral |
| Dec-13 | -0.27 | Neutral |
| Jan-14 | -0.43 | Neutral |
| Feb-14 | -0.38 | Neutral |
| Mar-14 | -0.15 | Neutral |
| Apr-14 | 0.11 | Neutral |
| May-14 | 0.15 | Neutral |
| Jun-14 | 0.00 | Neutral |
| Jul-14 | -0.14 | Neutral |
| Aug-14 | -0.09 | Neutral |
| Sep-14 | 0.06 | Neutral |
| Oct-14 | 0.35 | Neutral |
| Nov-14 | 0.54 | Neutral |
| Dec-14 | 0.62 | Neutral |
| Jan-15 | 0.54 | Neutral |
| Feb-15 | 0.47 | Neutral |
| Mar-15 | 0.59 | El Niño |
| Apr-15 | 0.72 | El Niño |
| May-15 | 0.89 | El Niño |
| Jun-15 | 1.02 | El Niño |
| Jul-15 | 1.27 | El Niño |
| Aug-15 | 1.54 | El Niño |
| Sep-15 | 1.80 | El Niño |
| Oct-15 | 2.03 | El Niño |
| Nov-15 | 2.18 | El Niño |
| Dec-15 | 2.25 | El Niño |
| Jan-16 | 2.14 | El Niño |
| Feb-16 | 1.81 | El Niño |
| Mar-16 | 1.30 | El Niño |
| Apr-16 | 0.65 | El Niño |
| May-16 | 0.08 | Neutral |
| Jun-16 | -0.43 | Neutral |
| Jul-16 | -0.70 | La Niña |
| Aug-16 | -0.81 | La Niña |
| Sep-16 | -0.88 | La Niña |
| Oct-16 | -0.96 | La Niña |
| Nov-16 | -0.96 | La Niña |
| Dec-16 | -0.89 | La Niña |
| Jan-17 | -0.60 | La Niña |
| Feb-17 | -0.44 | Neutral |
| Mar-17 | -0.18 | Neutral |
| Apr-17 | -0.10 | Neutral |
| May-17 | -0.02 | Neutral |
| Jun-17 | -0.04 | Neutral |
| Jul-17 | -0.23 | Neutral |
| Aug-17 | -0.46 | Neutral |
| Sep-17 | -0.62 | La Niña |
| Oct-17 | -0.82 | La Niña |
| Nov-17 | -0.97 | La Niña |
| Dec-17 | -1.14 | La Niña |
| Jan-18 | -1.08 | La Niña |
| Feb-18 | -1.04 | La Niña |
| Mar-18 | -0.90 | La Niña |
| Apr-18 | -0.69 | La Niña |
| May-18 | -0.33 | Neutral |
| Jun-18 | -0.02 | Neutral |
| Jul-18 | 0.08 | Neutral |
| Aug-18 | 0.16 | Neutral |
| Sep-18 | 0.35 | Neutral |
| Oct-18 | 0.62 | El Niño |
| Nov-18 | 0.82 | El Niño |
| Dec-18 | 0.78 | El Niño |
| Jan-19 | 0.68 | El Niño |
| Feb-19 | 0.64 | El Niño |
| Mar-19 | 0.57 | El Niño |
| Apr-19 | 0.53 | El Niño |
| May-19 | 0.37 | Neutral |
| Jun-19 | 0.24 | Neutral |
| Jul-19 | 0.04 | Neutral |
| Aug-19 | -0.12 | Neutral |
| Sep-19 | -0.01 | Neutral |
| Oct-19 | 0.15 | Neutral |
| Nov-19 | 0.29 | Neutral |
| Dec-19 | 0.22 | Neutral |
| Jan-20 | 0.14 | Neutral |
| Feb-20 | 0.10 | Neutral |
| Mar-20 | 0.02 | Neutral |
| Apr-20 | -0.25 | Neutral |
| May-20 | -0.55 | La Niña |
| Jun-20 | -0.72 | La Niña |
| Jul-20 | -0.76 | La Niña |
| Aug-20 | -0.85 | La Niña |
| Sep-20 | -1.16 | La Niña |
| Oct-20 | -1.37 | La Niña |
| Nov-20 | -1.46 | La Niña |
| Dec-20 | -1.39 | La Niña |
| Jan-21 | -1.32 | La Niña |
| Feb-21 | -1.18 | La Niña |
| Mar-21 | -1.08 | La Niña |
| Apr-21 | -0.89 | La Niña |
| May-21 | -0.68 | La Niña |
| Jun-21 | -0.57 | La Niña |
| Jul-21 | -0.60 | La Niña |
| Aug-21 | -0.76 | La Niña |
| Sep-21 | -0.95 | La Niña |
| Oct-21 | -1.08 | La Niña |
| Nov-21 | -1.24 | La Niña |
| Dec-21 | -1.22 | La Niña |
| Jan-22 | -1.18 | La Niña |
| Feb-22 | -1.13 | La Niña |
| Mar-22 | -1.19 | La Niña |
| Apr-22 | -1.26 | La Niña |
| May-22 | -1.17 | La Niña |
| Jun-22 | -0.95 | La Niña |
| Jul-22 | -0.86 | La Niña |
| Aug-22 | -0.94 | La Niña |
| Sep-22 | -1.07 | La Niña |
| Oct-22 | -1.10 | La Niña |
| Nov-22 | -1.05 | La Niña |
| Dec-22 | -0.99 | La Niña |
| Jan-23 | -0.86 | La Niña |
| Feb-23 | -0.68 | La Niña |
| Mar-23 | -0.55 | La Niña |
| Apr-23 | -0.31 | Neutral |
| May-23 | -0.04 | Neutral |
| Jun-23 | 0.28 | Neutral |
| Jul-23 | 0.54 | El Niño |
| Aug-23 | 0.79 | El Niño |
| Sep-23 | 1.04 | El Niño |
| Oct-23 | 1.30 | El Niño |
| Nov-23 | 1.42 | El Niño |
| Dec-23 | 1.40 | El Niño |
| Jan-24 | 1.13 | El Niño |
| Feb-24 | 0.78 | El Niño |
| Mar-24 | 0.42 | Neutral |
| Apr-24 | 0.04 | Neutral |
| May-24 | -0.28 | Neutral |
| Jun-24 | -0.45 | Neutral |
| Jul-24 | -0.49 | Neutral |
| Aug-24 | -0.56 | La Niña |
| Sep-24 | -0.67 | La Niña |
| Oct-24 | -0.76 | La Niña |
| Nov-24 | -0.88 | La Niña |
| Dec-24 | -1.05 | La Niña |
| Jan-25 | -1.10 | La Niña |
| Feb-25 | -0.85 | La Niña |
| Mar-25 | -0.66 | La Niña |
| Apr-25 | -0.50 | La Niña |
| May-25 | -0.48 | Neutral |
| Jun-25 | -0.36 | Neutral |
| Jul-25 | -0.41 | Neutral |
| Aug-25 | -0.59 | La Niña |
| Sep-25 | -0.78 | La Niña |
| Oct-25 | -0.93 | La Niña |
| Nov-25 | -0.98 | La Niña |
| Dec-25 | -1.04 | La Niña |
| Jan-26 | -0.91 | La Niña |
| Feb-26 | -0.76 | La Niña |
| Mar-26 | -0.44 | Neutral |
| Apr-26 | -0.04 | Neutral |
| May-26 | 0.49 | Neutral |
| Jun-26 | 0.97 | Neutral |
| Jul-26 | 1.36 | Neutral |
| Aug-26 | 1.69 | Neutral |
Figure 1 shows that ENSO has been a recurring phenomenon, with repeated changes between El Niño and La Niña. RONI measures central equatorial Pacific temperatures relative to the wider tropics using a three-month average. [note2] This helps separate ENSO variability from broader tropical sea-surface warming. Sustained positive values indicate El Niño conditions and negative values La Niña. More recently, the prolonged La Niña of 2020–23 was followed by El Niño in 2023–24, while RONI has risen sharply again during 2026.
| That raises the question – if the effects of ENSO spill over into the real economy, do these climate regimes leave a visible footprint in a country’s historical equity returns? |
|---|
We focus on FTSE Brazil, Chile, India, Indonesia, South Africa and Australia, using monthly total returns from 2000 to August 2026. [note3] The analysis covers countries with documented exposure to the climatic and macroeconomic effects of ENSO. [note4]
Figure 2 - Country excess returns across historical ENSO episodes
Source: FTSE Russell, NOAA Climate Prediction Center; FTSE Russell calculations. Data as of September 2026. Past performance is not a guide to future returns. Please see the end for important legal disclosures. [Note5]
| Episode | Phase | Episode start | Episode end | Brazil | South Africa | Indonesia | Chile | Australia | India |
|---|---|---|---|---|---|---|---|---|---|
| La Nina 1999-2000 | La Niña | Jan-99 | Jun-00 | 10.19 | 4.46 | 13.07 | -4.43 | 9.26 | 7.68 |
| La Nina 2000-2001 | La Niña | Oct-00 | Mar-01 | -0.48 | 1.59 | -1.20 | 1.04 | 1.61 | 0.73 |
| El Nino 2002-2003 | El Niño | Jul-02 | Jan-03 | 1.07 | 3.00 | -2.66 | 0.43 | 1.60 | 1.48 |
| El Nino 2004-2005 | El Niño | Jul-04 | Jan-05 | 2.65 | 1.48 | 3.02 | -0.52 | 2.84 | 1.96 |
| La Nina 2005-2006 | La Niña | Nov-05 | Mar-06 | 0.78 | 1.97 | 2.44 | -3.92 | -0.21 | 2.37 |
| El Nino 2006-2007 | El Niño | Sep-06 | Jan-07 | 0.95 | 0.88 | 0.64 | 2.18 | 0.68 | 1.41 |
| La Nina 2007-2008 | La Niña | Jul-07 | May-08 | 3.42 | -1.10 | 1.18 | -0.89 | 0.71 | -0.11 |
| La Nina 2008-2009 | La Niña | Nov-08 | Mar-09 | 0.51 | 1.78 | 2.85 | 2.42 | 2.33 | -0.71 |
| El Nino 2009-2010 | El Niño | Sep-09 | Mar-10 | 1.06 | -0.46 | 1.18 | 0.09 | 1.15 | 0.18 |
| La Nina 2010-2011 | La Niña | May-10 | May-11 | -0.58 | 0.68 | 1.05 | 1.65 | 0.21 | -0.86 |
| La Nina 2011-2012 | La Niña | Sep-11 | Mar-12 | 0.36 | -0.03 | -0.35 | 0.89 | -0.92 | -0.74 |
| El Nino 2015-2016 | El Niño | Mar-15 | Apr-16 | 0.50 | -0.09 | 0.14 | 0.57 | -0.38 | -0.12 |
| La Nina 2016-2017 | La Niña | Jul-16 | Jan-17 | 2.34 | -0.31 | -0.64 | -0.59 | 0.57 | -0.70 |
| La Nina 2017-2018 | La Niña | Sep-17 | Apr-18 | 0.52 | 0.36 | -1.23 | 0.99 | -0.74 | -0.19 |
| El Nino 2018-2019 | El Niño | Oct-18 | Apr-19 | 2.36 | 0.52 | 1.27 | -1.61 | -0.05 | 0.47 |
| La Nina 2020-2023 | La Niña | May-20 | Mar-23 | 0.78 | 0.72 | 0.82 | 0.69 | 0.32 | 0.91 |
| El Nino 2023-2024 | El Niño | Jul-23 | Feb-24 | 0.43 | -0.90 | -0.63 | -1.61 | -0.43 | 2.04 |
| La Nina 2024-2025 | La Niña | Aug-24 | Apr-25 | 0.01 | 0.88 | -2.18 | 1.69 | -0.22 | -1.38 |
| La Nina 2025-2026 | La Niña | Aug-25 | Feb-26 | 3.73 | 4.38 | -2.50 | 3.16 | 0.44 | -2.75 |
Brazil stands out, recording positive average monthly excess returns in 17 of 19 ENSO episodes, with a median return of 0.78% per month. South Africa, Chile and Australia also have positive median returns, but only around two-thirds of episodes are positive and the dispersion is considerably wider. [note6] India and Indonesia show little directional consistency, with positive returns in only around half of episodes. [note7]
The spread of outcomes suggests that the macroeconomic effects of ENSO do not translate uniformly into benchmark-relative equity performance. Even in Brazil, individual episodes range from modest underperformance to gains of roughly 4% per month relative to FTSE Emerging. A regression using the full monthly sample finds Brazil’s excess returns around 1.6 percentage points higher per month during active ENSO periods. Brazil also has the only statistically significant coefficient in the sample. [note8]
El Niño – from heat to rates
Despite mixed results on returns, OECD research across 23 advanced economies finds that ten additional days above 35°C reduce annual labour productivity by around 0.3%. Extreme heat can also affect CPI, suggesting some disconnect between returns and El Niño’s economic effects.
El Niño disrupts food production and transport, as crops are lost and river levels run low – increasing food and river transport costs. [note9] This then filters into the wider inflation picture in an affected country.
For example, Brazil’s central bank already incorporates a strong El Niño into its inflation outlook for 2026 and 2027. Its models point to an initially inflationary effect, particularly through food prices, before some of that effect unwinds as conditions normalise in 2027. [note10] In India, weaker monsoon rainfall associated with El Niño can also lift food inflation [note11] and, alongside higher commodity costs from the Middle East conflict, push interest rates higher. [note12]
That said, crops have come a long way – improvements in irrigation, crop breeding and farming practices have reduced the vulnerability of food production to a single drought. Global food stocks also remain relatively healthy, providing some buffer against a poor harvest in one major producer.
Even so, the OECD, in its latest forecast for 2027, treats El Niño as a downside risk to growth, particularly if the event remains very strong. With long-term sovereign yields already rising, and the conflict in the Middle East adding to inflation, higher food prices could add to existing global inflation and financing costs. [note13] This could leave central banks in emerging markets with less room to ease policy.
Brazil as a case study - why the economy and index diverge
Agriculture accounts for around 6.1% of GDP, according to IBGE national accounts data, while the agribusiness chain which includes inputs, primary production, agroindustry and services, accounted for 25.1% in 2025. [note14] Higher global crop prices can therefore support export revenues if domestic output remains unaffected. This can generate additional income, which in turn supports aggregate demand. So Brazil can simultaneously experience an external income benefit alongside higher domestic inflation. [note15]
Index structure is also key. As of 30 September, Financials account for 30% of FTSE Brazil, while Energy and Basic Materials constitute 22.4% and 13% respectively – totalling 65.4% of the index weight. Financials are more driven by financial conditions, while Energy and Basic Materials are more exposed to commodity prices and global trade. Consumer Staples accounts for 4.75% of index weight; Food and Beverage Production accounts for 3.4% of total FTSE Brazil revenues. This suggests that direct agricultural exposure in the index is relatively small. [note16] And index returns are more of a reflection of financial conditions, energy prices and global demand for basic materials.
So, while the active ENSO coefficient for Brazil is positive and statistically significant, [note17] the low R² is perhaps less surprising given the gap between agriculture’s economic importance and its direct representation in the index.
ENSO looks more useful as a regime indicator than a standalone trading signal. Its economic effects are real, particularly when other sources of inflation are already present. But the spillover into broad country equity returns is uneven. Brazil is an outlier case in our sample, but even there the low fit suggests ENSO remains a secondary input alongside earnings, valuations, policy and other fundamental drivers.

Footnotes
[1] The UK Met Office reported on 22 September that the 2026 El Niño had exceeded previous records, making it the strongest event in the observational record. NOAA had already declared El Niño conditions in June and expects the event to remain very strong through autumn and winter 2026–27. The Met Office also expects some of the temperature effects to carry into 2027. | Back to Note 1
[2] NOAA adopted the Relative Oceanic Niño Index (RONI) for official ENSO monitoring in 2026, replacing the traditional Oceanic Niño Index (ONI), which was becoming increasingly affected by longer-term changes in tropical sea-surface temperatures. RONI measures conditions in the Niño 3.4 region relative to the wider tropics, reducing the influence of background warming. | Back to Note 2
[3] ENSO regimes are classified using NOAA's Relative Oceanic Niño Index (RONI). FTSE Brazil, Chile, India, Indonesia and South Africa are assessed relative to FTSE Emerging, while Australia is compared with FTSE All-World. | Back to Note 3
[4]Cashin, Mohaddes and Raissi (2017) find markedly different responses to a typical El Niño episode across these economies. Economic activity declines in Australia, India, Indonesia and South Africa, while Chile experiences an initial contraction followed by recovery and Brazil a delayed positive response. Their estimates cover 1979 to 2013 and illustrate the differing economic exposure to ENSO across the sample, rather than ranking countries by vulnerability. | Back to Note 4
[5] The ongoing 2026 El Niño is excluded from the episode-return analysis because a complete episode return is not yet available. | Back to Note 5
[6] Previous research by Ginn (2024), using real equity returns across a broader 20-economy sample, finds a more common phase-dependent response, with positive effects associated with El Niño and negative effects with La Niña. Our analysis differs by examining benchmark-relative FTSE country returns across discrete ENSO episodes. | Back to Note 6
[7] Methodological note: The estimated El Niño and La Niña effects are statistically indistinguishable; we find no evidence that one phase matters more than the other. | Back to Note 7
[8]Monthly regressions use HAC standard errors with 12 lags. For Brazil, the active ENSO coefficient was +1.64 percentage points per month (p=0.004; R²=0.015) relative to FTSE Emerging. Most other country estimates did not provide strong statistical evidence of a regime effect. Estimates describe historical associations and should not be interpreted as causal effects. | Back to Note 8
[9]Lower domestic agricultural production in India has led policymakers to restrict food exports, as occurred during the 2023 El Niño. But at the time the world was still adjusting to the loss of Ukrainian production. | Back to Note 9
[10]Analysts surveyed by the bank estimate a median El Niño impact on inflation of 0.3 percentage points in 2026 and 0.4 percentage points in 2027. | Back to Note 10
[11]About a third of India’s consumer price index consists of food costs. | Back to Note 11
[12]The conflict has also disrupted fertiliser supply and raised agricultural input costs through more expensive fuel and freight. Lower water levels can also reduce hydropower output, which accounts for around 6% of India’s power mix. | Back to Note 12
[13]OECD expects global growth of 3.0% in 2027, down from 3.1% in its June forecast, with the commodity-price shock from the Middle East proving more persistent than previously assumed. | Back to Note 13
[14]Hydropower is also important, accounting for around 52% of Brazil’s electricity supply in 2025 EPE, Brazilian Energy Balance 2026, while the Amazon-region waterways are major corridors for agricultural exports Brazilian Ministry of Ports and Airports. | Back to Note 14
[15]Policy response - Brazil’s tariff-flag system passes changes in electricity-generation costs through to consumers more quickly when hydrological conditions deteriorate. Brazilian Ministry of Agrarian Development - July 2026 measure can also cushion agricultural losses; a 2026 measure provided debt restructuring for farmers affected by severe climate events between 2019 and 2025, with an estimated annual impact on the public accounts of less than R$4 billion. | Back to Note 15
[16] Food and beverages account for around 22% of Brazil’s IPCA basket, despite the relatively small direct food exposure represented in FTSE Brazil. | Back to Note 16
[17] Separately, recent research on Brazilian equities finds a positive market-wide risk premium associated with unexpected changes in temperature. | Back to Note 17

Disclaimer
© [2026] London Stock Exchange Group plc and its applicable group undertakings (“LSEG”). LSEG includes (1) FTSE International Limited (“FTSE”), (2) Frank Russell Company (“Russell”), (3) FTSE Global Debt Capital Markets Inc. “FTSE Canada”, (4) FTSE Fixed Income LLC (“FTSE FI”), (5) FTSE (Beijing) Consulting Limited (“WOFE”), (6) FTSE EU SAS ("FES"). All rights reserved.
FTSE Russell® is a trading name of FTSE, Russell, FTSE Canada, FTSE FI, WOFE, FTSE EU and other LSEG entities providing LSEG Benchmark and Index services. “FTSE®”, “Russell®”, “FTSE Russell®”, “FTSE4Good®”, “ICB®”, “Refinitiv”, “WMR™” “FR™” and all other trademarks and service marks used herein (whether registered or unregistered) are trademarks and/or service marks owned or licensed by the applicable member of LSEG or their respective licensors.
FTSE International Limited is authorised as a Benchmark Administrator and regulated in the United Kingdom (UK) by the Financial Conduct Authority ("FCA") according to the UK Benchmark Regulation, FCA Reference Number 796803. FTSE EU SAS is authorised as Benchmark Administrator and regulated in the European Union (EU) by the Autorité des Marches Financiers (“AMF”) according to the EU Benchmark Regulation.
All information is provided for information purposes only. All information and data contained in this publication is obtained by LSEG, from sources believed by it to be accurate and reliable. Because of the possibility of human and mechanical inaccuracy as well as other factors, however, such information and data is provided "as is" without warranty of any kind. No member of LSEG nor their respective directors, officers, employees, partners or licensors make any claim, prediction, warranty or representation whatsoever, expressly or impliedly, either as to the accuracy, timeliness, completeness, merchantability of any information or LSEG Products, or of results to be obtained from the use of LSEG products, including but not limited to indices, rates, data and analytics, or the fitness or suitability of the LSEG products for any particular purpose to which they might be put. The user of the information assumes the entire risk of any use it may make or permit to be made of the information.
No responsibility or liability can be accepted by any member of LSEG nor their respective directors, officers, employees, partners or licensors for (a) any loss or damage in whole or in part caused by, resulting from, or relating to any inaccuracy (negligent or otherwise) or other circumstance involved in procuring, collecting, compiling, interpreting, analysing, editing, transcribing, transmitting, communicating or delivering any such information or data or from use of this document or links to this document or (b) any direct, indirect, special, consequential or incidental damages whatsoever, even if any member of LSEG is advised in advance of the possibility of such damages, resulting from the use of, or inability to use, such information.
No member of LSEG nor their respective directors, officers, employees, partners or licensors provide investment advice and nothing in this document should be taken as constituting financial or investment advice. No member of LSEG nor their respective directors, officers, employees, partners or licensors make any representation regarding the advisability of investing in any asset or whether such investment creates any legal or compliance risks for the investor. A decision to invest in any such asset should not be made in reliance on any information herein. Indices and rates cannot be invested in directly. Inclusion of an asset in an index or rate is not a recommendation to buy, sell or hold that asset nor confirmation that any particular investor may lawfully buy, sell or hold the asset or an index or rate containing the asset. The general information contained in this publication should not be acted upon without obtaining specific legal, tax, and investment advice from a licensed professional.
Past performance is no guarantee of future results. Charts and graphs are provided for illustrative purposes only. Index and/or rate returns shown may not represent the results of the actual trading of investable assets. Certain returns shown may reflect back-tested performance. All performance presented prior to the index or rate inception date is back-tested performance. Back-tested performance is not actual performance, but is hypothetical. The back-test calculations are based on the same methodology that was in effect when the index or rate was officially launched. However, back-tested data may reflect the application of the index or rate methodology with the benefit of hindsight, and the historic calculations of an index or rate may change from month to month based on revisions to the underlying economic data used in the calculation of the index or rate.
This document may contain forward-looking assessments. These are based upon a number of assumptions concerning future conditions that ultimately may prove to be inaccurate. Such forward-looking assessments are subject to risks and uncertainties and may be affected by various factors that may cause actual results to differ materially. No member of LSEG nor their licensors assume any duty to and do not undertake to update forward-looking assessments.
No part of this information may be reproduced, stored in a retrieval system or transmitted in any form or by any means, electronic, mechanical, photocopying, recording or otherwise, without prior written permission of the applicable member of LSEG. Use and distribution of LSEG data requires a licence from LSEG and/or its licensors.