

Nelson Huang

Ryuichi Urino
Why policy reform, investor demographics and portfolio needs could create room for a broader NISA product shelf
NISA in brief. In 2014, Japan launched the NISA (Nippon Individual Savings Account), modelled on the UK’s ISA, to encourage household asset formation through tax-exempt investing. The framework evolved through the General NISA and the Tsumitate NISA before a major 2024 reform made the scheme permanent, made the tax-exempt holding period indefinite, expanded annual allowances and allowed the Tsumitate and Growth quotas to be used together. For global asset managers, this evolution has turned the NISA from a tax wrapper into one of Japan’s core retail product distribution channels. [note1]
Executive summary
- Equity NISAs currently dominate. The Japan Securities Dealers Association’s (JSDA’s) 2025 NISA survey showed that the three largest equity index categories alone represented 73.8% of reported Tsumitate-purchased security types. In Growth, an Investment Management Association of Japan (IMAJ) survey found much higher holding rates for foreign and domestic equity funds than for balanced or bond funds.
- Policy is opening the door for other asset class NISAs. The Financial Services Agency (FSA) has explicitly broadened Tsumitate eligibility to encompass bond-focused and balanced investment trusts, partly to help investors with relatively low risk tolerance take a first step into investing.
- The addressable base is broader than growth-seeking investors. Cash and deposits still represent 47.2% of Japanese household financial assets, while 29.3% of the population is aged 65 or above. These groups are likely to place greater weight on capital stability, income and drawdown control than on maximum equity growth.
- Balanced products can bridge the gap. A one-ticket equity/fixed-income solution can offer a smoother transition from cash to investing and can serve investors whose horizon or risk tolerance does not fit a 100% equity portfolio.
- The opportunity is a spectrum, not one allocation. Illustrative 0/100, 25/75, 50/50, 75/25 and 100/0 equity/fixed-income mixes show how historical return and volatility changed as equity exposure increased.
1. NISA has scale — but the product mix remains equity-led
At end-2025, Japan had about 28.26 million NISA accounts and total 2025 purchases of approximately JPY 18.8tn. NISA is now a major retail investment channel, rather than just a niche tax wrapper. [note2] [note3]
The strongest evidence of product crowding is visible within NISAs’ aggregate asset allocation: JSDA’s 2025 NISA survey showed that the three major global and U.S. equity index categories accounted for 73.8% of reported Tsumitate purchase types, compared with just 6.1% for balanced and multi-asset index funds. Similarly, growth quota surveys show a materially higher penetration of domestic and foreign equity funds than balanced or bond funds.
Tsumitate product type purchased |
% of respondents |
|---|---|
Index fund – Global equities including Japan |
34.2% |
Index fund – U.S. equities |
24.0% |
Index fund – Global equities excluding Japan |
15.6% |
Combined three major equity-index categories |
73.8% |
Index fund – Balanced / multi-asset |
6.1% |
Source: Japan Securities Dealers Association, 2025 New NISA Usage Survey [note4] Past performance is not a guide to future returns. Please see the end for important legal disclosures.
2. Policy changes open the door for fixed income and balanced NISAs
As of 30 September 2026, the FSA listed 371 products eligible for the NISA Tsumitate Investment Quota, including 198 equity funds, 162 multi-asset funds and 11 ETFs. Despite multi-asset funds accounting for approximately 44% of eligible products, investor adoption remains heavily equity-oriented. The JSDA's 2025 survey showed that only 6.1% of respondents reported purchasing balanced index funds, compared with a combined 73.8% across the three major global and U.S. equity index categories. [note6] 28.pdf
This gap raises an important product development question: why do investors continue to favour equity funds, despite the broad availability of multi-asset alternatives? Potential explanations include stronger historical equity returns, the simplicity and popularity of global equity index funds and limited awareness of the diversification benefits of combining equities and bonds. Rather than simply adding more balanced funds, the opportunity may lie in developing a clearly differentiated, easy-to-understand balanced fund series, with transparent equity/fixed-income allocations and distinct risk profiles, ranging from conservative to growth-oriented strategies.
The policy direction is now changing. In 2026, the FSA broadened certain eligibility conditions for funds investing mainly in equities to allow multi-asset funds including equities and public/corporate bonds. The FSA said the change is intended to expand bond-focused and balanced options and to make it easier for people with relatively low risk tolerance — including younger and older investors — to take their first step into investing. [note7] [note8]
This regulatory change has created product development opportunities to serve different NISA investor needs:
- a lower-volatility entry point for cash-heavy households;
- a diversified one-ticket solution for investors uncomfortable with 100% equity exposure; and
- a fixed-income building block for investors who already own global equities.
3. Which investor bases could fixed income and balanced NISAs address?
While NISA investment activity remains heavily concentrated in equities, evidence from Japan's broader investment fund market suggests meaningful demand for professionally managed investment solutions.
According to NLI Research 投信市場では国内株式を見直す動きも |ニッセイ基礎研究所, separately managed account-dedicated (SMA-dedicated) investment trusts attracted JPY 1.43 trillion in net inflows during the first half of 2026, the highest comparable first-half level since 2015. The study also found that much of the inflow into domestic bond funds came through SMA-dedicated products. In addition, according to the Investment Trusts Association Japan's 2025 survey (general_research2025_report.pdf), awareness of investment trust risks, including potential capital losses, remained at just 48.2%, with particularly limited understanding among investors in their twenties. The survey also highlighted an increasing fear of investment losses among individuals who had never purchased investment trusts.
While these findings primarily highlight the importance of financial education, they also suggest that investors have different goals and a varying tolerance for risk, with many valuing diversification, risk management and simplicity alongside long-term growth. As a result, investment approaches other than equity-only strategies may be relevant for some investors. In the table below, we highlight several investor groups that may find fixed-income and balanced fund solutions worth considering within a NISA.
| Investor segment | Market evidence | Potential need | Balance Product angle |
|---|---|---|---|
| Cash-heavy / first-time investors | Nearly half of household financial assets remain in cash and deposits. | A step into markets without moving immediately to full equity risk. | Bond-focused fund or conservative balanced fund. |
| Older / near-retirement investors | Near 30% of Japan’s population is aged 65+; 65+ households are a large part of the household base. | Greater emphasis may be placed on capital stability, income and shorter effective horizons. | Bond-focused or lower-equity balanced strategies; hedged options may also matter. |
| Existing equity-heavy NISA investors | Global and U.S. equity index funds continue to dominate inflows. | Diversify an existing equity core without forcing investors to build a multi-fund portfolio themselves. | 50/50 or 75/25 balanced funds; global government bonds like WGBI as the fixed-income sleeve. |
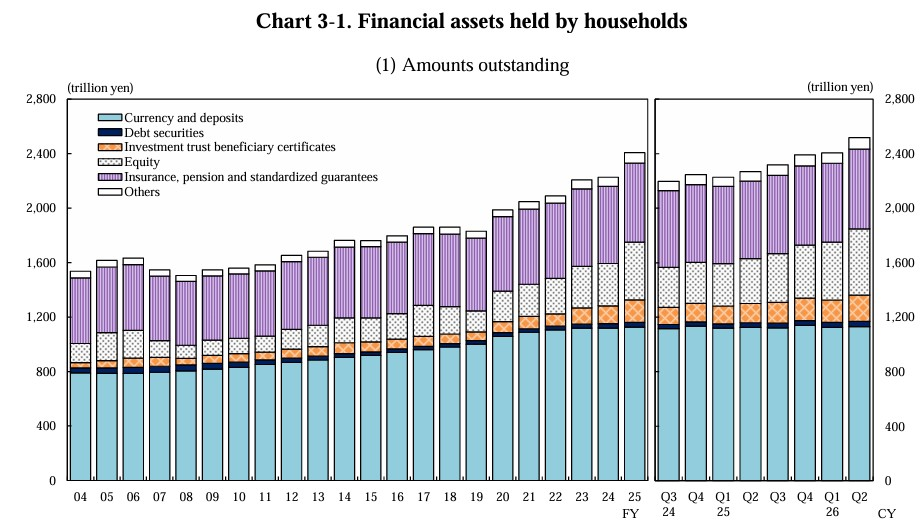
Source: Basic Figures: Flow of Funds for the Second Quarter of 2026 (Preliminary report) Past performance is not a guide to future returns. Please see the end for important legal disclosures.
| Period | Currency & Deposits | Debt Securities | Investment Trusts | Equity | Insurance/Pension | Others |
|---|---|---|---|---|---|---|
| FY2004 | ~780 | ~40 | ~40 | ~140 | ~520 | ~30 |
| FY2005 | ~800 | ~40 | ~45 | ~160 | ~550 | ~30 |
| FY2006 | ~790 | ~40 | ~60 | ~180 | ~530 | ~30 |
| ... | ... | ... | ... | ... | ... | ... |
| FY2025 | ~1150 | ~35 | ~150 | ~500 | ~580 | ~35 |
| Q2 2026 | ~1160 | ~35 | ~160 | ~520 | ~570 | ~40 |
4. Spanning the full equity/fixed income spectrum
For product design, the relevant question isn’t whether equities or bonds are a better asset class. It is how different mixes change the risk profile. Figure 3 below shows examples across five illustrative equity/fixed-income allocations with performance simulations in both unhedged Japanese Yen and hedged Japanese Yen. Global equities are represented by the FTSE All-World Index; fixed income by the FTSE World Government Bond index excluding Japan.
Figure 3. Illustrative risk and return of different NISA equity/fixed income allocations (unhedged JPY v.s. hedged JPY)
Illustrative positioning |
Allocation |
10Y return (unhedged/ hedged) |
10Y volatility (unhedged/ hedged)
|
Return / volatility (unhedged/ hedged)
|
Potential target use |
Pure global fixed income |
100% FTSE WGBI ex Japan |
4.69% -2.01% |
6.12% 4.64% |
0.77 -0.43 |
Capital stability / income-oriented building block |
Conservative balanced |
25% All-World + 75% WGBI ex Japan |
8.03% 1.19% |
7.57% 5.51% |
1.06 0.22 |
Cash-to-market transition; cautious investors |
Balanced |
50% All-World + 50% WGBI ex Japan |
11.35% 4.39% |
9.83% 7.74% |
1.16 0.57 |
Single-ticket middle-risk allocation |
Growth balanced |
75% All-World + 25% WGBI ex Japan |
14.66% 7.57% |
12.46% 10.49% |
1.18 0.72 |
Equity core with a risk-dampening sleeve |
Pure equity |
100% FTSE All-World |
17.95% 10.72% |
15.27% 13.45% |
1.18 0.8 |
Maximum equity participation; crowded incumbent segment |
The key product design observation is that there is no single “correct” balanced allocation, nor a single correct approach to managing currency risk—over the past ten years, pure equity offers better return with higher volatility, whereas pure fixed income allocation generates the worst performance despite lower volatility. A manager can build a family of clearly segmented products — for example conservative, balanced and growth-balanced like 50/50 or 75/25 multi-asset allocation — around the same underlying equity and fixed income building blocks and offering different currency management policies. That makes the risk choice more visible to the investor and gives distributors a simpler way to match products to different time horizons and to varying tolerance for drawdowns.
5. Conclusion: competing in less mature market segments
The most crowded part of the NISA market is already clear: equity products dominate both reported Tsumitate purchase types and Growth-quota fund holdings. While further equity NISA launches would have to compete in an already established segment, fixed income and balanced products could address a different use case — investors seeking diversification, lower portfolio volatility or a more gradual step away from cash.
Fixed income and balanced products therefore offer a different proposition. Policy is explicitly expanding the eligible toolkit and Japan also remains cash-heavy at the household level. Together, these points create a credible product-development question: whether a more diverse NISA offering can reach those investors whose needs are not fully served by today’s equity-led market.[8]
A practical product question for asset managers is therefore: where on the 0/100 to 100/0 spectrum is the market underserved — and can a simple, low-cost, clearly positioned NISA product fill that gap?
Appendix
[1] Japan Financial Services Agency (FSA), “NISAを知る” https://www.fsa.go.jp/policy/nisa2/know/ | Back to Note 1
[2] Japan Financial Services Agency (FSA), NISA account usage survey as of 31 December 2025. https://www.fsa.go.jp/policy/nisa/20260703.html | Back to Note 2
[3] Japan Securities Dealers Association (JSDA), 2025 NISA purchase trends. https://www.jsda.or.jp/shiryoshitsu/toukei/files/nisajoukyou/new_nisaall3.pdf| Back to Note 3
[4] Japan Securities Dealers Association (JSDA), 2025 survey of new NISA purchase types. https://www.jsda.or.jp/houdou/kaiken/files/260218shiryou4.pdf | Back to Note 4
[6] Japan Financial Services Agency (FSA), FSA — Tsumitate Investment Quota Eligible Products, 30 September 2026 fsa.go.jp/policy/nisa2/products/20260930/28.pdf | Back to Note 6
[7] FSA, April 2026 amendment broadening certain Tsumitate eligibility from mainly equities to mainly equities or public/corporate bonds. https://www.fsa.go.jp/news/r7/sonota/20260401-3/20260401.html | Back to Note 7
[8] FSA, 金融庁広報誌アクセスFSA No. 273. https://www.fsa.go.jp/access/r7/273.html | Back to Note 8

Disclaimer
© [2026] London Stock Exchange Group plc and its applicable group undertakings (“LSEG”). LSEG includes (1) FTSE International Limited (“FTSE”), (2) Frank Russell Company (“Russell”), (3) FTSE Global Debt Capital Markets Inc. “FTSE Canada”, (4) FTSE Fixed Income LLC (“FTSE FI”), (5) FTSE (Beijing) Consulting Limited (“WOFE”), (6) FTSE EU SAS ("FES"). All rights reserved.
FTSE Russell® is a trading name of FTSE, Russell, FTSE Canada, FTSE FI, WOFE, FTSE EU and other LSEG entities providing LSEG Benchmark and Index services. “FTSE®”, “Russell®”, “FTSE Russell®”, “FTSE4Good®”, “ICB®”, “Refinitiv”, “WMR™” “FR™” and all other trademarks and service marks used herein (whether registered or unregistered) are trademarks and/or service marks owned or licensed by the applicable member of LSEG or their respective licensors.
FTSE International Limited is authorised as a Benchmark Administrator and regulated in the United Kingdom (UK) by the Financial Conduct Authority ("FCA") according to the UK Benchmark Regulation, FCA Reference Number 796803. FTSE EU SAS is authorised as Benchmark Administrator and regulated in the European Union (EU) by the Autorité des Marches Financiers (“AMF”) according to the EU Benchmark Regulation.
All information is provided for information purposes only. All information and data contained in this publication is obtained by LSEG, from sources believed by it to be accurate and reliable. Because of the possibility of human and mechanical inaccuracy as well as other factors, however, such information and data is provided "as is" without warranty of any kind. No member of LSEG nor their respective directors, officers, employees, partners or licensors make any claim, prediction, warranty or representation whatsoever, expressly or impliedly, either as to the accuracy, timeliness, completeness, merchantability of any information or LSEG Products, or of results to be obtained from the use of LSEG products, including but not limited to indices, rates, data and analytics, or the fitness or suitability of the LSEG products for any particular purpose to which they might be put. The user of the information assumes the entire risk of any use it may make or permit to be made of the information.
No responsibility or liability can be accepted by any member of LSEG nor their respective directors, officers, employees, partners or licensors for (a) any loss or damage in whole or in part caused by, resulting from, or relating to any inaccuracy (negligent or otherwise) or other circumstance involved in procuring, collecting, compiling, interpreting, analysing, editing, transcribing, transmitting, communicating or delivering any such information or data or from use of this document or links to this document or (b) any direct, indirect, special, consequential or incidental damages whatsoever, even if any member of LSEG is advised in advance of the possibility of such damages, resulting from the use of, or inability to use, such information.
No member of LSEG nor their respective directors, officers, employees, partners or licensors provide investment advice and nothing in this document should be taken as constituting financial or investment advice. No member of LSEG nor their respective directors, officers, employees, partners or licensors make any representation regarding the advisability of investing in any asset or whether such investment creates any legal or compliance risks for the investor. A decision to invest in any such asset should not be made in reliance on any information herein. Indices and rates cannot be invested in directly. Inclusion of an asset in an index or rate is not a recommendation to buy, sell or hold that asset nor confirmation that any particular investor may lawfully buy, sell or hold the asset or an index or rate containing the asset. The general information contained in this publication should not be acted upon without obtaining specific legal, tax, and investment advice from a licensed professional.
Past performance is no guarantee of future results. Charts and graphs are provided for illustrative purposes only. Index and/or rate returns shown may not represent the results of the actual trading of investable assets. Certain returns shown may reflect back-tested performance. All performance presented prior to the index or rate inception date is back-tested performance. Back-tested performance is not actual performance, but is hypothetical. The back-test calculations are based on the same methodology that was in effect when the index or rate was officially launched. However, back-tested data may reflect the application of the index or rate methodology with the benefit of hindsight, and the historic calculations of an index or rate may change from month to month based on revisions to the underlying economic data used in the calculation of the index or rate.
This document may contain forward-looking assessments. These are based upon a number of assumptions concerning future conditions that ultimately may prove to be inaccurate. Such forward-looking assessments are subject to risks and uncertainties and may be affected by various factors that may cause actual results to differ materially. No member of LSEG nor their licensors assume any duty to and do not undertake to update forward-looking assessments.
No part of this information may be reproduced, stored in a retrieval system or transmitted in any form or by any means, electronic, mechanical, photocopying, recording or otherwise, without prior written permission of the applicable member of LSEG. Use and distribution of LSEG data requires a licence from LSEG and/or its licensors.