

Miko Huang
South Korea is home to some of the world’s best-known technology, semiconductor, automotive and industrial companies. Its businesses sit at the heart of global supply chains and play an increasingly important role in the artificial intelligence (AI) buildout.
The success of Korea’s largest companies, however, has also created a challenge for index-based investors: how can investors maintain meaningful exposure to the market leaders while avoiding excessive dependence on a small number of stocks?
The FTSE South Korea RIC Capped index is designed to address that challenge.
Increased concentration is the flipside of Korea’s success
The Korean equity market includes global leaders such as Samsung Electronics and SK Hynix. As these companies have grown, their increasing market capitalisations have translated into increasingly large weights in a market capitalisation-weighted benchmark.
Concentration in the (uncapped) FTSE Korea index is not a new phenomenon. Samsung Electronics has accounted for more than 20% of the index since the index launch. By 30 September 2026, its weight had risen to 33.22%, while SK Hynix represented another 27.31%.
This level of index concentration means that movements in just two companies can have an outsized influence on the performance and risk characteristics of the overall benchmark. Uncapped market capitalisation weights also reduce the representation of other companies and industries across the Korean equity market.
To address this challenge, we launched the FTSE South Korea RIC Capped index and the FTSE Korea 30/18 Capped index in 2017 and 2019, respectively. Both indices retain exposure to the same Korean large- and mid-cap opportunity set, while managing concentration through index rules designed to comply with fund regulations.
Keep the leaders. Manage the concentration.
The FTSE South Korea RIC Capped Index applies a capping methodology designed with Regulated Investment Company (RIC) concentration requirements for US-registered funds in mind. The FTSE Korea 30/18 Capped index follows the capping methodology created in consideration of the European Investment in Transferable Securities (UCITS), the European Union’s regulation for retail investment funds.
In the RIC Capped index, we cap constituent weights quarterly so that no more than 20% of the index is allocated to a single constituent, while the combined weight of constituents individually representing more than 4.5% of the index does not exceed 48%. In the 30/18 Capped index, at each quarter, any constituent weight exceeding 30% is capped at 30% of the index, and any remaining companies in the index with a weight greater than 18% is capped at 18%.
Following application of the capping methodologies, Samsung Electronics represented 18.66% of the FTSE South Korea RIC Capped index and 27.81% of the FTSE Korea 30/18 Capped index at 30 September 2026 respectively, compared with 33.22% in the uncapped FTSE Korea Index. SK Hynix represented 19.97% and 17.86% of the two capped indices, respectively, compared with 27.31% of the uncapped index.
Exhibit 1. Largest 10 constituents
| Company Name | Industry | FTSE South Korea RIC Capped index | FTSE Korea 30/18 Capped index | FTSE Korea index |
|---|---|---|---|---|
| Samsung Electronics | Telecommunications | 18.66% | 27.81% | 33.22% |
| SK Hynix | Technology | 19.97% | 17.86% | 27.31% |
| Samsung Electronics Pfd. | Telecommunications | 2.36% | 3.52% | 4.20% |
| SK Square | Technology | 4.56% | 3.93% | 2.73% |
| Samsung Electro-Mechanics | Technology | 3.73% | 3.22% | 2.23% |
| KB Financial Group | Financials | 2.58% | 2.22% | 1.54% |
| Hyundai Motor | Consumer Discretionary | 2.08% | 1.79% | 1.24% |
| Shinhan Financial Group | Financials | 1.99% | 1.71% | 1.19% |
| Doosan Enerbility | Industrials | 1.62% | 1.40% | 0.97% |
| Hana Financial Group | Financials | 1.53% | 1.32% | 0.92% |
| Total | 59.08% | 64.77% | 75.54% |
Source: FTSE Russell; as of 30 September 2026. Past performance is not a guide to future returns. Past performance is not a guide to future returns. Please see the end for important legal disclosures.
Reducing the weight of the two dominant companies creates greater room for the rest of the market. As a result, the FTSE South Korea RIC Capped index and FTSE Korea 30/18 Capped index provide broader representation across industries such as financials, industrials and consumer discretionary.
Exhibit 2. FTSE South Korea RIC Capped index and FTSE Korea 30/18 Capped index demonstrate greater industry diversification
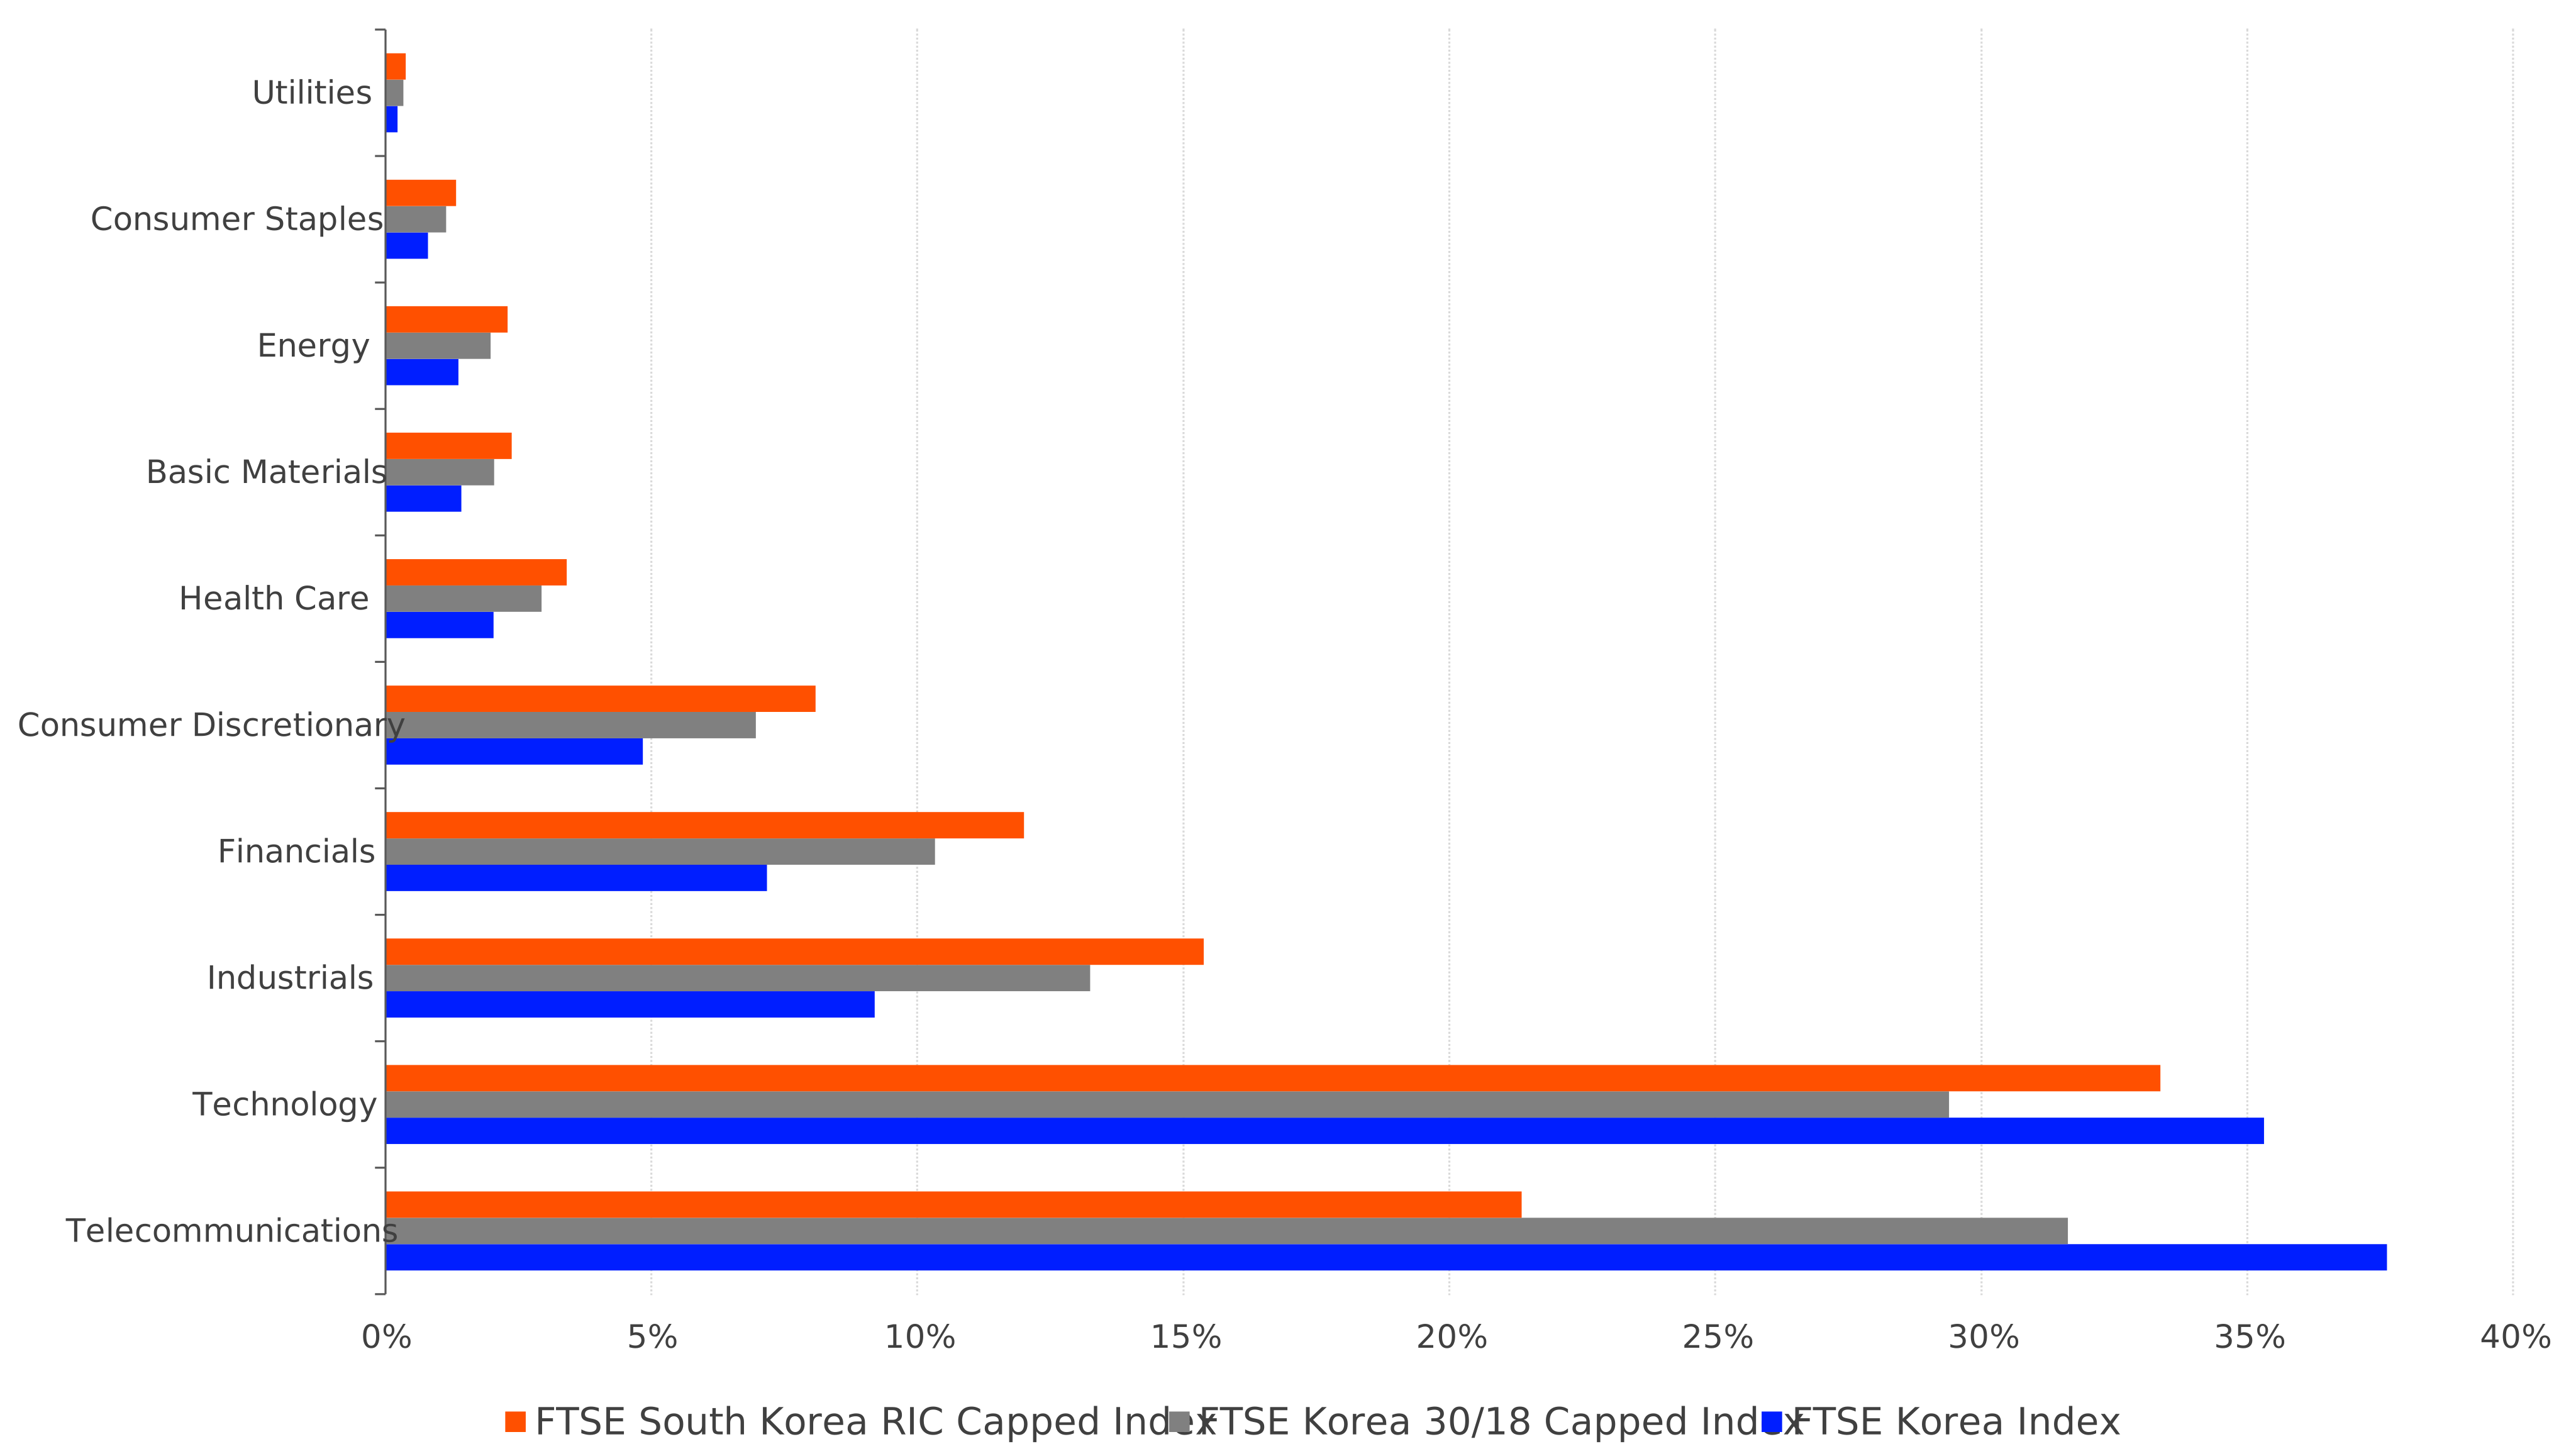
Source: FTSE Russell; as of 30 September 2026. Past performance is not a guide to future returns. Please see the end for important legal disclosures.
| Industry | FTSE South Korea RIC Capped Index | FTSE Korea 30/18 Capped Index | FTSE Korea Index |
|---|---|---|---|
| Utilities | ~0.4% | ~0.3% | ~0.2% |
| Consumer Staples | ~1.3% | ~1.2% | ~0.8% |
| Energy | ~2.3% | ~2.0% | ~1.4% |
| Basic Materials | ~2.4% | ~2.0% | ~1.4% |
| Health Care | ~3.4% | ~2.9% | ~2.0% |
| Consumer Discretionary | ~8.1% | ~7.0% | ~4.8% |
| Financials | ~12.0% | ~10.3% | ~7.2% |
| Industrials | ~15.4% | ~13.2% | ~9.2% |
| Technology | ~33.4% | ~29.4% | ~35.3% |
| Telecommunications | ~21.4% | ~31.6% | ~37.6% |
Putting a number on diversification
The benefit of capping becomes even clearer when we look beyond individual stock weights and measure diversification across the index as a whole.
A measure called “Effective N” provides one way to do this. It translates constituent weights into the equivalent number of equally weighted securities. A higher Effective N indicates that index weight is distributed more broadly, while a lower number signals greater concentration.
Applying the Effective N calculation to the uncapped and capped Korean equity indices is particularly revealing.
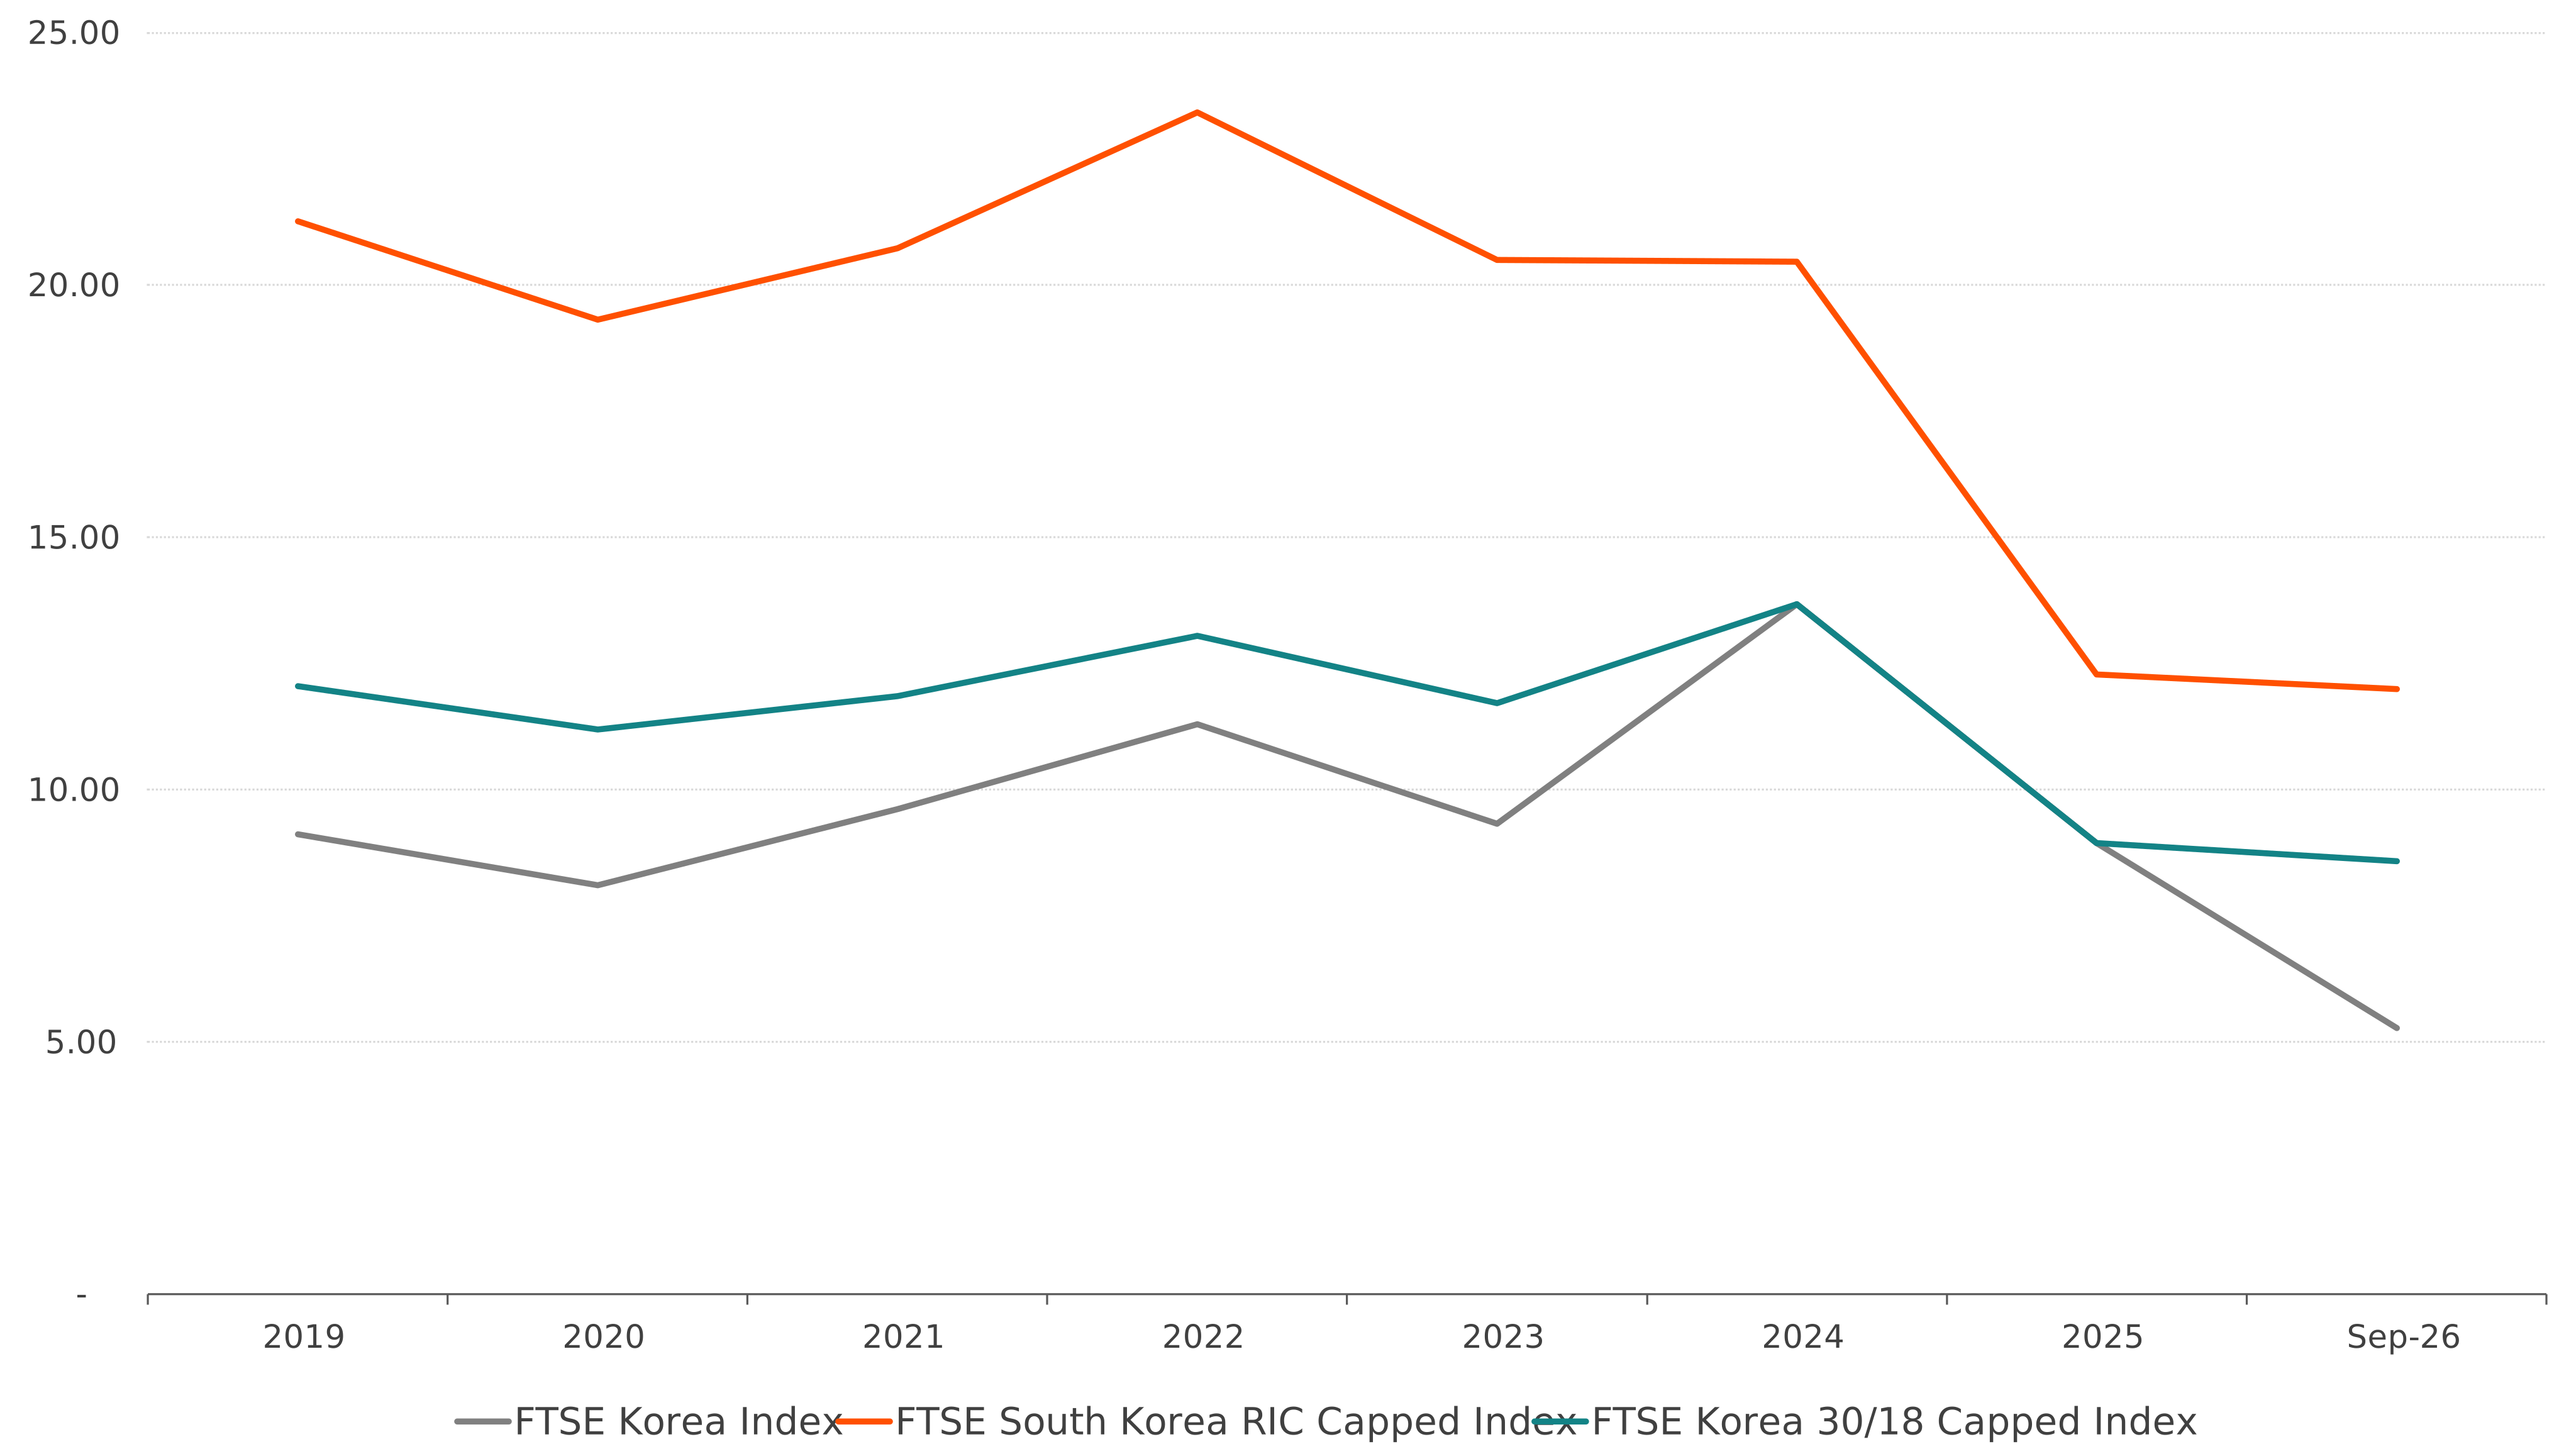
As of 30 September 2026, all three indices contained 142 constituents. The investment opportunity set is therefore the same, but the distribution of weight is markedly different. The uncapped FTSE Korea Index had an Effective N of only 5.27, compared with 11.99 for the FTSE South Korea RIC Capped index and 8.58 for the FTSE Korea 30/18 Capped index.
In other words, the RIC Capped approach more than doubled the effective breadth of the uncapped benchmark, while the 30/18 framework also produced a materially broader distribution of weight.
In Figure 3, we show the Effective N for all three Korean indices between December 2019 and September 2026. The FTSE South Korean RIC Capped index had consistently higher breadth than the FTSE Korea index, while the FTSE Korea 30/18 capped index also had a higher Effective N (in some of the years, the UCITS cap was not triggered).
Exhibit 3. Effective N for uncapped and capped indices
| Date | FTSE Korea Index | FTSE South Korea RIC Capped Index | FTSE Korea 30/18 Capped Index |
|---|---|---|---|
| 2019 | ~9.0 | ~21.3 | ~12.0 |
| 2020 | ~8.0 | ~19.2 | ~11.2 |
| 2021 | ~9.5 | ~20.5 | ~11.9 |
| 2022 | ~11.3 | ~23.3 | ~13.1 |
| 2023 | ~9.2 | ~20.5 | ~11.7 |
| 2024 | ~13.5 | ~20.5 | ~13.7 |
| 2025 | ~8.8 | ~12.4 | ~8.9 |
| Sep 2026 | 5.27 | 11.99 | 8.58 |
Concentration can matter for returns
Capping inevitably changes the way an index participates when its largest constituents either outperform or underperform the rest of the market.
This can be clearly seen in the historical performance of Samsung Electronics and SK Hynix. Over the 10 years to 30 September 2026, SK Hynix delivered a cumulative USD return of 3,485.1%, while Samsung Electronics returned 581.7%.
Over the same period, the FTSE Korea index returned 257.6%, versus 232.9% for the FTSE South Korea RIC Capped index. The 24.7% gap reflects the uncapped index's greater exposure to its strongest-performing leaders. The FTSE Korea 30/18 Capped index returned 261.5%, as its capping methodology was not triggered in every year and its weights therefore remained closer to those of the uncapped benchmark for parts of the period.
Exhibit 4 makes the trade-off explicit: an uncapped index can capture more upside when the largest stocks surge, while a capped index reduces reliance on those same names when leadership reverses. The FTSE Korea 30/18 Capped index has delivered performance broadly comparable to, and over some periods slightly better than, the FTSE Korea index. This largely reflects the fact that the 30/18 capping thresholds were not triggered in every year, allowing the index weights to remain close to those of the the uncapped index. The choice is therefore not simply about maximising past returns, but about deciding how much single-stock concentration an investor is willing to carry.
Exhibit 4. Samsung and SK Hynix index weights have driven the difference in return
| Cumulative Return (%, price return, USD) | ||||||||
|---|---|---|---|---|---|---|---|---|
| Index | 1M | 3M | 6M | YTD | 1Y | 3Y | 5Y | 10Y |
| Samsung Electronics | 4.1 | -8.3 | 78.3 | 137.4 | 231.2 | 291.9 | 216.3 | 581.7 |
| SK Hynix | 6.9 | -23.6 | 144.3 | 189.2 | 428.9 | 1446 | 1405.1 | 3485.1 |
| FTSE South Korea RIC Capped Index | 0 | -6.5 | 63.5 | 86.5 | 132.1 | 218.4 | 127.3 | 232.9 |
| FTSE Korea 30/18 Capped Index | 2.1 | -9.5 | 65.1 | 90.9 | 140.2 | 222.6 | 133.6 | 261.5 |
| FTSE Korea Index | 2.1 | -9.5 | 65.1 | 90.9 | 140.2 | 219.9 | 131.9 | 257.6 |
| Difference 1* | 2.2 | -3 | 1.6 | 4.4 | 8.1 | 1.5 | 4.7 | 24.7 |
| Difference 2# | 0 | 0 | 0 | 0 | 0 | -2.7 | -1.6 | -4 |
* Difference 1 = cumulative return of the FTSE Korea Index – cumulative return of the FTSE South Korea RIC Capped index
# Difference 2 = cumulative return of the FTSE Korea Index – cumulative return of the FTSE Korea 30/18 Capped index
Source: FTSE Russell; as of 30 September 2026. Past performance is not a guide to future returns. Returns shown prior to index launch reflect hypothetical historical performance.
Broader diversification, historically lower volatility
The diversification benefits of capping have also historically been reflected in the risk characteristics of the index.
Across the periods shown below, the FTSE South Korea RIC Capped index recorded lower annualised volatility than the FTSE Korea Index over one, three, five and ten years to 30 September 2026, while the FTSE Korea 30/18 Capped Iindex displayed volatility similar to that of the uncapped index.
The difference is particularly intuitive in the context of the steadily increasing market concentration in the Korean equity market over the period. As Samsung Electronics, SK Hynix and the associated technology exposure became a larger part of the uncapped index, the performance of the overall benchmark became increasingly sensitive to that of a relatively small number of securities.
Exhibit 5. The RIC Capped approach has historically delivered lower volatility
| Volatility (%pa) | ||||
|---|---|---|---|---|
| Index | 1Y | *3Y | **5Y | **10Y |
| FTSE South Korea RIC Capped Index | 56.9 | 38 | 39.3 | 31.3 |
| FTSE Korea 30/18 Capped Index | 62.9 | 39.4 | 40.3 | 32.1 |
| FTSE Korea Index | 62.9 | 39.4 | 40.3 | 32.1 |
Source: FTSE Russell; as of 30 September 2026. Past performance is not a guide to future returns. Returns shown prior to index launch reflect hypothetical historical performance.
Conclusion: let the leaders lead, but not dominate
South Korea’s economy has boomed and its equity market leaders are global success stories, but their scale can also create significant concentration for index-based equity investors.
The FTSE South Korea RIC Capped Index offers a deliberate balance: it retains meaningful exposure to Korea’s largest companies while distributing more weight across the wider market. The FTSE Korea 30/18 Capped Index provides a second route for investors seeking a UCITS-oriented capping framework that can remain closer to the uncapped market’s constituent weights when its thresholds are not triggered.
For investors, the question is not whether to participate in Korea’s success, but how to define that exposure. Capped indices keep the leaders at the centre of the story while giving more of the market a meaningful role in the outcome.


Disclaimer
© [2026] London Stock Exchange Group plc and its applicable group undertakings (“LSEG”). LSEG includes (1) FTSE International Limited (“FTSE”), (2) Frank Russell Company (“Russell”), (3) FTSE Global Debt Capital Markets Inc. “FTSE Canada”, (4) FTSE Fixed Income LLC (“FTSE FI”), (5) FTSE (Beijing) Consulting Limited (“WOFE”), (6) FTSE EU SAS ("FES"). All rights reserved.
FTSE Russell® is a trading name of FTSE, Russell, FTSE Canada, FTSE FI, WOFE, FTSE EU and other LSEG entities providing LSEG Benchmark and Index services. “FTSE®”, “Russell®”, “FTSE Russell®”, “FTSE4Good®”, “ICB®”, “Refinitiv”, “WMR™” “FR™” and all other trademarks and service marks used herein (whether registered or unregistered) are trademarks and/or service marks owned or licensed by the applicable member of LSEG or their respective licensors.
FTSE International Limited is authorised as a Benchmark Administrator and regulated in the United Kingdom (UK) by the Financial Conduct Authority ("FCA") according to the UK Benchmark Regulation, FCA Reference Number 796803. FTSE EU SAS is authorised as Benchmark Administrator and regulated in the European Union (EU) by the Autorité des Marches Financiers (“AMF”) according to the EU Benchmark Regulation.
All information is provided for information purposes only. All information and data contained in this publication is obtained by LSEG, from sources believed by it to be accurate and reliable. Because of the possibility of human and mechanical inaccuracy as well as other factors, however, such information and data is provided "as is" without warranty of any kind. No member of LSEG nor their respective directors, officers, employees, partners or licensors make any claim, prediction, warranty or representation whatsoever, expressly or impliedly, either as to the accuracy, timeliness, completeness, merchantability of any information or LSEG Products, or of results to be obtained from the use of LSEG products, including but not limited to indices, rates, data and analytics, or the fitness or suitability of the LSEG products for any particular purpose to which they might be put. The user of the information assumes the entire risk of any use it may make or permit to be made of the information.
No responsibility or liability can be accepted by any member of LSEG nor their respective directors, officers, employees, partners or licensors for (a) any loss or damage in whole or in part caused by, resulting from, or relating to any inaccuracy (negligent or otherwise) or other circumstance involved in procuring, collecting, compiling, interpreting, analysing, editing, transcribing, transmitting, communicating or delivering any such information or data or from use of this document or links to this document or (b) any direct, indirect, special, consequential or incidental damages whatsoever, even if any member of LSEG is advised in advance of the possibility of such damages, resulting from the use of, or inability to use, such information.
No member of LSEG nor their respective directors, officers, employees, partners or licensors provide investment advice and nothing in this document should be taken as constituting financial or investment advice. No member of LSEG nor their respective directors, officers, employees, partners or licensors make any representation regarding the advisability of investing in any asset or whether such investment creates any legal or compliance risks for the investor. A decision to invest in any such asset should not be made in reliance on any information herein. Indices and rates cannot be invested in directly. Inclusion of an asset in an index or rate is not a recommendation to buy, sell or hold that asset nor confirmation that any particular investor may lawfully buy, sell or hold the asset or an index or rate containing the asset. The general information contained in this publication should not be acted upon without obtaining specific legal, tax, and investment advice from a licensed professional.
Past performance is no guarantee of future results. Charts and graphs are provided for illustrative purposes only. Index and/or rate returns shown may not represent the results of the actual trading of investable assets. Certain returns shown may reflect back-tested performance. All performance presented prior to the index or rate inception date is back-tested performance. Back-tested performance is not actual performance, but is hypothetical. The back-test calculations are based on the same methodology that was in effect when the index or rate was officially launched. However, back-tested data may reflect the application of the index or rate methodology with the benefit of hindsight, and the historic calculations of an index or rate may change from month to month based on revisions to the underlying economic data used in the calculation of the index or rate.
This document may contain forward-looking assessments. These are based upon a number of assumptions concerning future conditions that ultimately may prove to be inaccurate. Such forward-looking assessments are subject to risks and uncertainties and may be affected by various factors that may cause actual results to differ materially. No member of LSEG nor their licensors assume any duty to and do not undertake to update forward-looking assessments.
No part of this information may be reproduced, stored in a retrieval system or transmitted in any form or by any means, electronic, mechanical, photocopying, recording or otherwise, without prior written permission of the applicable member of LSEG. Use and distribution of LSEG data requires a licence from LSEG and/or its licensors.