

Lydia Hamill

Paul Amery
Key Takeaways
- AI is driving a record debt-financing cycle
Amazon, Alphabet, Meta, Microsoft and Oracle have rapidly increased borrowing to support AI infrastructure spending, with investment-grade issuance already more than doubling 2025 levels.
- Hyperscalers are becoming more influential in bond indices
As debt issuance grows, hyperscalers represent a larger share of corporate bond benchmarks, meaning their performance and credit spreads increasingly affect index returns.
- Investors need more sophisticated ways to measure AI exposure
Traditional sector classifications do not fully capture the AI ecosystem, creating demand for more granular benchmark construction and thematic fixed income solutions.
The artificial intelligence (AI) build-out is becoming impossible for bond investors to ignore. JPMorgan now estimates that total global AI-related capital expenditures will reach $5.5 trillion through to 2030[note1]. The extent of this investment has meant that the group of companies commonly referred to as ‘hyperscalers’[note2] are broadening their mix of funding sources well beyond operating cash flows alone.
Now, investors can fund the AI build-out via multiple debt channels, such as investment-grade (IG) corporate bonds, securitised credit, private credit, leveraged finance and equity-linked debt. Within the IG corporate bond space (expected to be the largest source of external capital for the hyperscalers [note3]),the amount issued by early October 2026 ($218.1bn) had already more than doubled the total for the whole of 2025 ($107.3bn).
This sudden surge in IG corporate bond issuance is forecast to accelerate – in fact, J.P. Morgan estimates that capex for these five hyperscalers will reach $697 billion by end of 2026[note4].
The extent of this borrowing has led to most of the hyperscalers diversifying into currencies beyond the US dollar (USD). While USD-denominated bond sales still dwarf issuance in other currencies, euro-denominated debt has become the second most popular currency market to tap, with new debt issuance reaching totals of $15.0bn (US dollar equivalent) in 2025 and $24.6bn so far in 2026. 2026 has also seen new hyperscaler debt being issued in sterling, the Swiss franc, the Japanese yen and the Australian and Canadian dollars (see Chart 1).
Chart 1: Total investment-grade debt issued by hyperscalers from 2020 to 2026, in USD bn
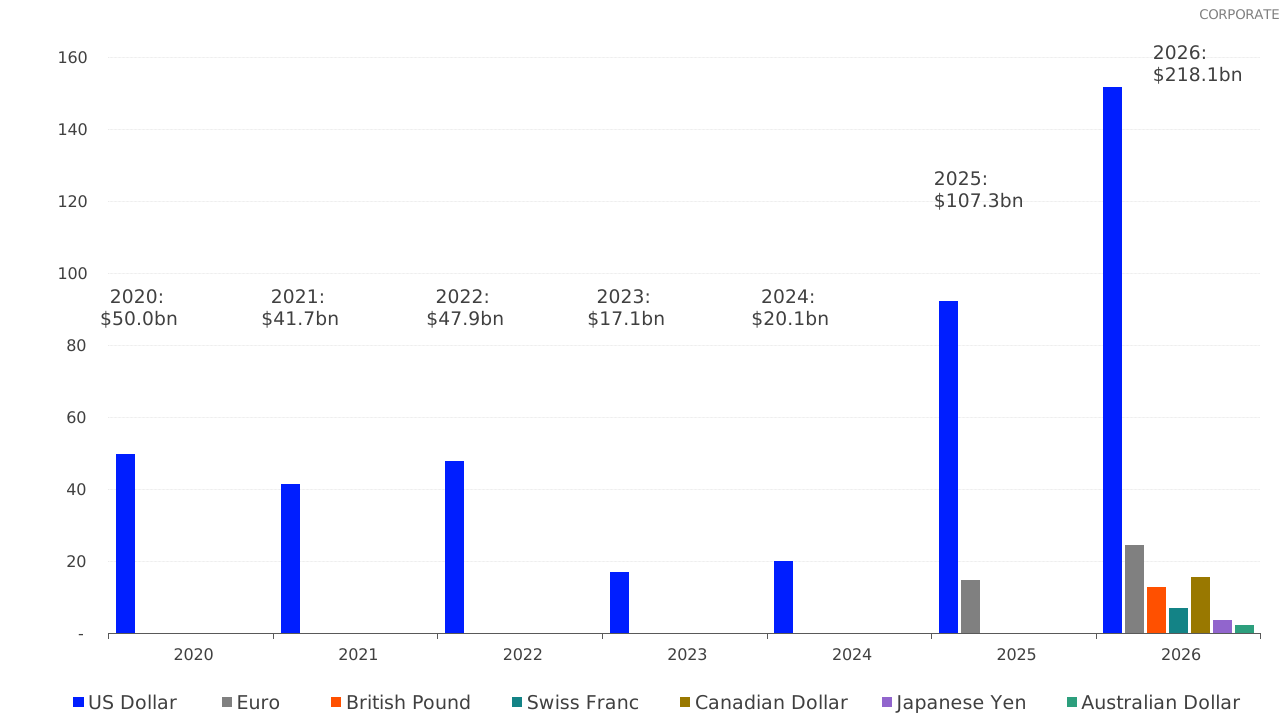
Source: FTSE Russell, data from LSEG Workspace, as at 02 Oct 2026. The chart shows index-eligible debt from 5 hyperscalers (tickers: ORCL, MSFT, AMZN, GOOGL, META), denominated in USD, EUR, GBP, CHF, JPY and AUD. Includes fixed-rate bonds only (excludes commercial paper and preferred stock). Year totals cover total amount issued across all currencies shown. Shows amount issued, ignoring taps or repurchases. Past performance is not a guide to future returns. Please see the end for important legal disclosures.
| Principal Currency | 2020 | 2021 | 2022 | 2023 | 2024 | 2025 | 2026 |
|---|---|---|---|---|---|---|---|
| US Dollar | 50.00 | 41.68 | 47.88 | 17.14 | 20.09 | 92.25 | 151.75 |
| Euro | - | - | - | - | - | 15.02 | 24.65 |
| British Pound | - | - | - | - | - | - | 12.91 |
| Swiss Franc | - | - | - | - | - | - | 7.03 |
| Canadian Dollar | - | - | - | - | - | - | 15.82 |
| Japanese Yen | - | - | - | - | - | - | 3.66 |
| Australian Dollar | - | - | - | - | - | - | 2.26 |
Just how much are these hyperscalers issuing?
Across the five FTSE Russell indices tracking investment grade (“IG”) corporate bonds denominated in US dollar, sterling, the Swiss franc, the Japanese yen, the Australian and Canadian dollars [note5] , the total hyperscaler debt outstanding was $500bn as at the end-August 2026 index profile date (see Chart 2). At that date, the largest hyperscaler debt issuer was Amazon (with $144.8bn outstanding), closely followed by Google ($120.4bn) and Oracle ($117.2bn).
While Oracle’s bonds have only made it into the dollar-denominated FTSE US Broad Investment-Grade Bond Index so far, Amazon has diversified its issuance with euro- and Swiss franc-denominated debt. However, by currency the most diversified issuer is Google: at end-August, the company’s debt was present in all five FTSE IG corporate bond indices. Finally, Meta and Microsoft were placed fourth and fifth among the hyperscaler issuers at end-August, with $81.2bn and $36.5bn in bonds outstanding, respectively.
Chart 2: Total hyperscaler index-eligible IG debt outstanding (across FTSE USBIG, FTSE Pan-EuroBIG, FTSE AUSBIG, FTSE Canada Universe and FTSE JPBIG)
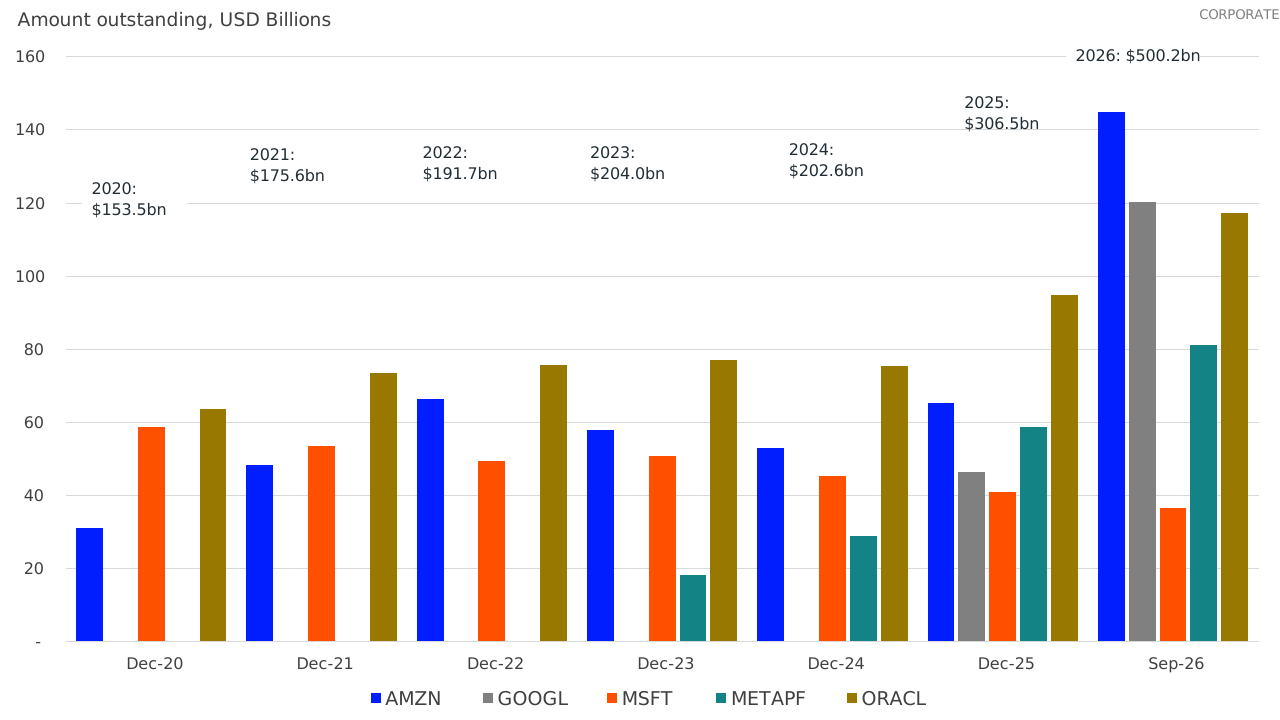
Source: FTSE Russell, data as of 31 December for each year, except 2026 (as of 31 August 2026). Data as of September 2026. Past performance is not a guide to future returns. Please see the end for important legal disclosures.
| Principal Currency | 2020 | 2021 | 2022 | 2023 | 2024 | 2025 | 2026 |
|---|---|---|---|---|---|---|---|
| US Dollar | 50.00 | 41.68 | 47.88 | 17.14 | 20.09 | 92.25 | 151.75 |
| Euro | - | - | - | - | - | 15.02 | 24.65 |
| British Pound | - | - | - | - | - | - | 12.91 |
| Swiss Franc | - | - | - | - | - | - | 7.03 |
| Canadian Dollar | - | - | - | - | - | - | 15.82 |
| Japanese Yen | - | - | - | - | - | - | 3.66 |
| Australian Dollar | - | - | - | - | - | - | 2.26 |
For investors, IG debt offers an alternative route (via contractual income and a claim on enterprise cash flows) into the AI buildout, versus or alongside equity participation. As of end-September 2026, hyperscalers accounted for 4.7% of the FTSE US BIG Corporate index and 1.2% of the FTSE Euro IG Corporate index by market value weight (up from 2.7% in the USBIG Corp and 0.08% in the EuroBIG Corp indices 2 years earlier).
The sudden surge in issuance from this segment can broaden and diversify corporate bond sectors while simultaneously concentrating portfolios in a relatively small group of borrowers sharing the same investment cycle. While hyperscalers’ debt still has a relatively small index footprint, it is now significant enough to impact top-line index performance.
Collectively, the US dollar-denominated bonds of the hyperscalers underperformed the FTSE US Broad IG Corporate index over the 5 years to September 2026, with higher annualised volatility (see Table 1). Excluding hyperscalers from the index would have slightly improved its performance over the period.
Table 1: Performance summary for the FTSE US Broad IG Corporate index with and without the Hyperscalers
FTSE USBIG Corporate |
FTSE USBIG Corporate ex Hyperscalers |
Hyperscalers only |
|
Annualised return |
-0.42% |
-0.34% |
-2.86% |
Annualised volatility |
7.66% |
7.62% |
9.49% |
Source: FTSE Russell, unhedged US dollar returns from September 2021 to September 2026. Past performance is not a guide to future returns.
On average, hyperscalers now have a higher duration, yield and coupon than the FTSE US Broad IG Corporate index. However, while the five hyperscaler issuers have an index weighted average A+ rating, the stand-out issuer is the higher-yielding Oracle, with an average BBB- rating, shorter average life, lower duration and option-adjusted credit spreads (OAS) currently around 100 basis points (bps) higher than its peers (see Table 2).
While Oracle is a cloud provider, it differs from the rest of the hyperscalers in having entered cloud computing after the initial, web-driven horizontal scaling era. As a result, Oracle has been raising substantial debt since 2016 to “catch up” [note6]. It was downgraded by S&P from A to BBB+ in 2021, to BBB in 2022, and then again to BBB- (the lowest investment grade credit rating) in 2026.
Table 2: Key index statistics for the FTSE US Broad IG Corporate Index, versus the 5 Hyperscalers, 31 August 2026
| Index | Count | Par amount (USD bn) | Market value (USD bn) | Weighted average life | Yield to worst | Effective duration | OAS (bps) | Coupon | Quality |
|---|---|---|---|---|---|---|---|---|---|
| USBIG CORP | 9,302 |
8,270.37 |
7,475.01 |
10.95 |
6.07 |
6.42 |
86 |
4.64 |
A- |
| USBIG CORP ex Hyperscalers | 9,130 |
7,847.35 |
7,118.38 |
10.61 |
6.05 |
6.32 |
85 |
4.63 |
A- |
| Hyperscalers | 172 |
423.02 |
356.63 |
17.27 |
6.53 |
8.37 |
119 |
4.68 |
A+ |
AMAZON.COM INC |
42 |
117.00 |
102.16 |
15.82 |
6.04 |
7.85 |
75 |
4.46 |
AA |
ORACLE CORP |
52 |
117.24 |
94.16 |
15.70 |
7.40 |
7.48 |
210 |
4.85 |
BBB- |
META PLATFORMS INC |
25 |
81.22 |
71.94 |
19.26 |
6.61 |
8.79 |
123 |
5.24 |
AA- |
ALPHABET INC |
30 |
73.75 |
66.06 |
17.41 |
6.08 |
8.53 |
74 |
4.78 |
AA+ |
MICROSOFT CORP |
23 |
33.81 |
22.32 |
22.69 |
6.11 |
12.69 |
54 |
3.26 |
AAA |
Source: FTSE Russell, data as of 30 September 2026. Past performance is not a guide to future returns. Please see the end for important legal disclosures.
While Microsoft, Alphabet (Google) and Amazon trade with OAS below the FTSE USBIG Corp index average, Oracle's bonds trade at wider OAS than the other four issuers (see Chart 3). Investors are already demanding more compensation to take on Oracle’s debt, but the prospect of further downgrades (resulting in junk status) would likely raise investor concerns further. As of 21 October, the five-year credit default swap (CDS) spreads for Oracle stood at 331 bps, versus 80 bps for Amazon and 56 bps for Microsoft, representing a five-year default probability of 25%, 7% and 5%, respectively. In particular, Oracle's CDS spread is now well above the typical levels for a BBB-rated issuer (~150-200 bps), suggesting the market may be pricing in downgrade risk already .
However, in the event of an S&P downgrade to below investment grade, Oracle would not necessarily become ineligible for IG indices; this would depend on the rating logic pertaining to the specific index provider.
In the case of the FTSE USBIG Corporate Index, Oracle would have to lose its investment-grade rating from Moody’s (the agency’s lowest investment grade rating is Baa3, while Oracle’s current rating is Baa2), as well as its BBB- rating from S&P, for its bonds to be removed from the index. This is because, in the case of a split rating between the two credit rating agencies, FTSE Russell takes the higher rating. However, in the case of its removal from the FTSE USBIG Corporate index, the firm’s debt could be eligible for the FTSE US High Yield Market index, which includes bonds from issuers with ratings ranging from BB+/Ba1 down to C/Ca (excluding defaults).
Other index providers may use different rules to assess eligibility for investment grade corporate bond indices, particularly in the case of split ratings, so it’s worth checking the ground rules of the index concerned.
Chart 3: Hyperscalers’ option-adjusted credit spreads across the curve
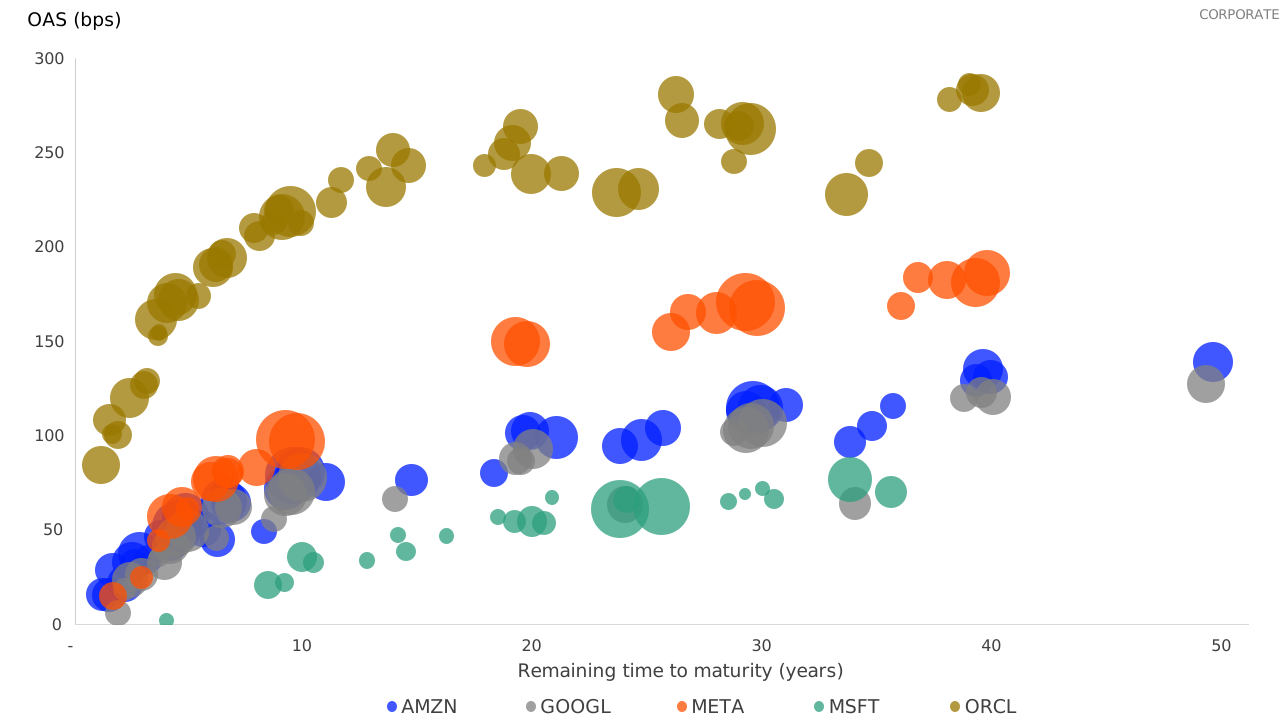
Source: FTSE Russell, bonds included in FTSE US BIG Corporate index, as of 30 September 2026. Bubble area size represents amount outstanding in USD. Past performance is not a guide to future returns. Please see the end for important legal disclosures.
| Remaining time to maturity (years) | Amazon (AMZN) OAS (bps) | Google (GOOGL) OAS (bps) | Meta (META) OAS (bps) | Microsoft (MSFT) OAS (bps) | Oracle (ORCL) OAS (bps) |
|---|---|---|---|---|---|
| 1-2 | 5-20 | 10-15 | 10-15 | 5-10 | 75-95 |
| 3-5 | 25-45 | 25-40 | 50-65 | 10-20 | 120-160 |
| 6-10 | 45-85 | 45-85 | 70-110 | 25-45 | 180-215 |
| 15-20 | 70-105 | 65-105 | 150-160 | 45-65 | 220-250 |
| 25-30 | 90-120 | 65-115 | 155-175 | 65-75 | 215-265 |
| 35-40 | 95-135 | 70-130 | 170-195 | 75-80 | 220-270 |
| 49-50 | 130-135 | 130-135 | Not shown | Not shown | Not shown |
The widening of hyperscalers’ credit spreads could, in theory, be due to perceived “dot-com”-style red flags in the AI industry, such as circular financing arrangements, execution risks and rising borrowing costs. However, the spread widening may also reflect the massive influx of supply to the US IG bond market (which in turn has driven the need by hyperscalers to diversify their bond issuance across currencies).
As is shown in Chart 4, hyperscalers (as a simple market value-weighted cohort) previously traded at a lower OAS than the broader FTSE US BIG Corporate index, but since November 2025, this has reversed and their spreads now trade above it. By October 2026, hyperscalers’ OAS stood at 119 bps, compared with 86 bps for the broader index—a premium of 33 bps. Since December 2025, the group’s OAS has widened by approximately 31 bps, while the index’s OAS has widened by 1 bp.
The divergence illustrates how headline index spreads can mask substantial changes within issuer groups, reinforcing the importance of looking beyond broad-market averages to understand the exposures embedded in corporate bond benchmarks.
Chart 4: Market value-weighted OAS (bps) for the FTSE US BIG Corp index and the 5 hyperscalers (left scale) and the difference in OAS (right scale).
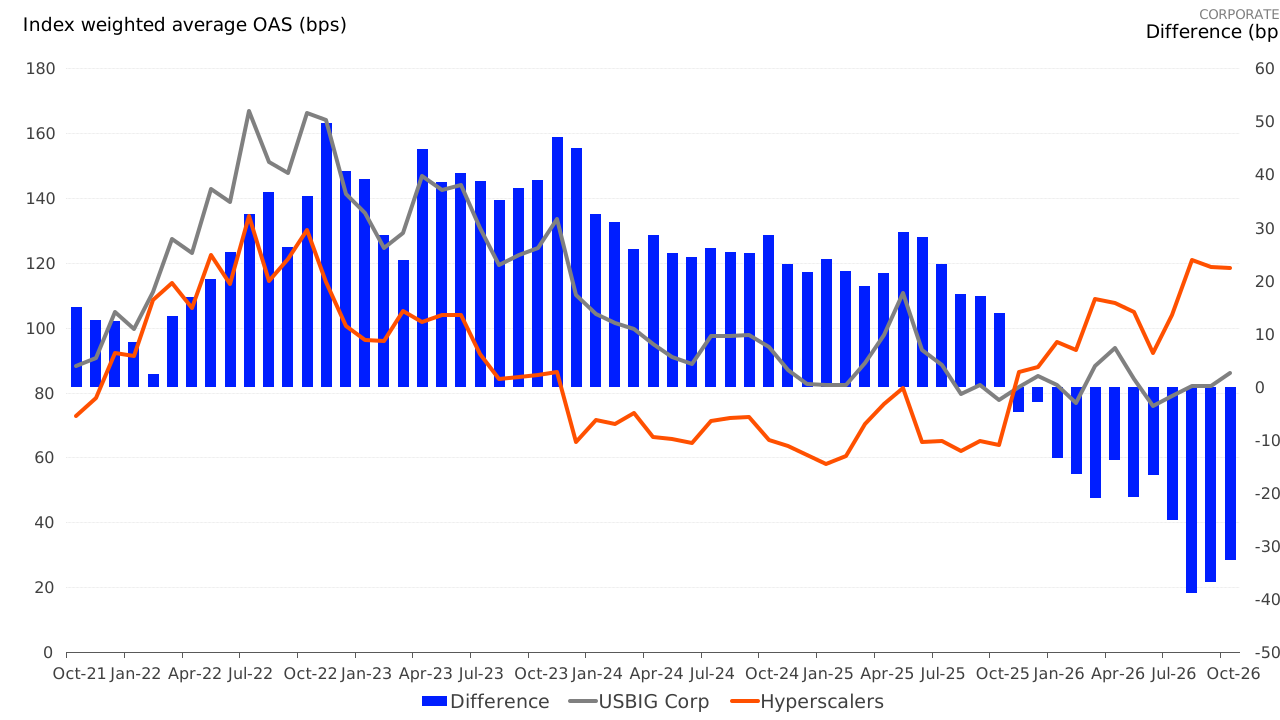
Source: FTSE Russell, daily OAS data covering 2 March 2026 to 21 October 2026. For each currency index, AMZN and GOOGL are market value weighted, and term buckets (1-3 year, 3-5 year, 5-7 year, 7-10 year and 10+ year) are equal-weighted, with bonds market value-weighted within them. Past performance is not a guide to future returns. Please see the end for important legal disclosures.
| Date | USBIG Corp OAS (bps) | Hyperscalers OAS (bps) | Difference (bps) |
|---|---|---|---|
| Sep-21 | ~92 | ~77 | ~15 |
| Dec-21 | ~105 | ~95 | ~10 |
| Mar-22 | ~125 | ~115 | ~20 |
| Jun-22 | ~168 | ~132 | ~36 |
| Sep-22 | ~148 | ~115 | ~33 |
| Dec-22 | ~142 | ~102 | ~40 |
| Mar-23 | ~125 | ~96 | ~29 |
| Jun-23 | ~145 | ~104 | ~41 |
| Sep-23 | ~120 | ~85 | ~35 |
| Dec-23 | ~105 | ~65 | ~40 |
| Mar-24 | ~100 | ~72 | ~28 |
| Jun-24 | ~89 | ~66 | ~23 |
| Sep-24 | ~98 | ~73 | ~25 |
| Dec-24 | ~82 | ~62 | ~20 |
| Mar-25 | ~82 | ~58 | ~24 |
| Jun-25 | ~110 | ~82 | ~28 |
| Sep-25 | ~80 | ~62 | ~18 |
| Dec-25 | ~86 | ~88 | ~-2 |
| Mar-26 | ~78 | ~109 | ~-31 |
| Jun-26 | ~92 | ~91 | ~1 |
| Sep-26 | ~82 | ~120 | ~-38 |
However, the extent of hyperscaler credit spread changes has differed across currencies. In Chart 5, the blue line represents the euro-denominated hyperscaler issues, whose credit spreads have mostly tightened since April 2026 (the first euro-denominated issue by Amazon occurred in March 2026), while the US dollar bonds’ spreads (the red line) show a large widening over the same period. These spread comparisons are term bucket-adjusted, but this is not quite a like-for-like funding cost comparison due to residual differences in duration, issuer weights, bond liquidity and so on.
Chart 5: OAS differential between EUR and USD bonds issued by Amazon and Alphabet
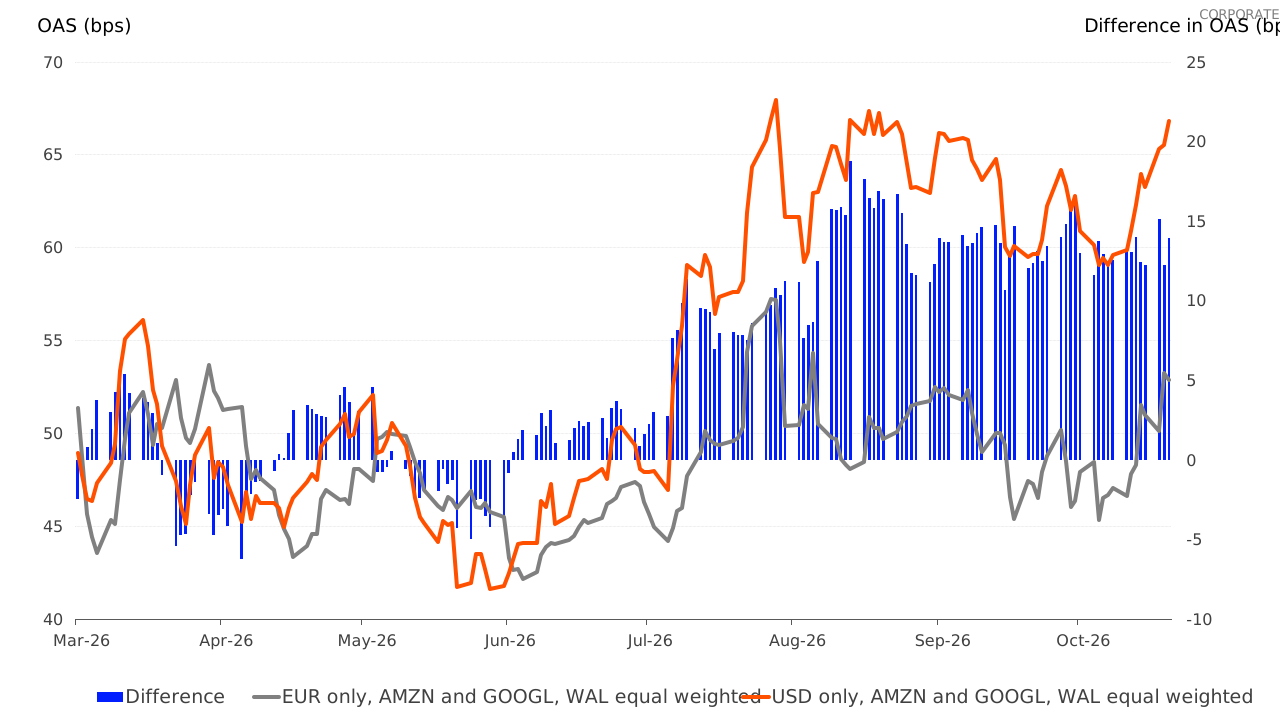
Source: FTSE Russell, daily OAS data covering March 2026 to September 2026. For each currency index, AMZN and GOOGL are market value weighted, and term buckets (1-3 year, 3-5 year, 5-7 year, 7-10 year and 10+ year) are equal-weighted, with bonds market value-weighted within them. Past performance is not a guide to future returns. Please see the end for important legal disclosures.
| Date | USD Basket OAS (bps) | EUR Basket OAS (bps) | Difference (bps) |
|---|---|---|---|
| Mar-26 | ~49 | ~49 | ~0 |
| Apr-26 | ~46 | ~50 | ~-4 |
| May-26 | ~49 | ~45 | ~4 |
| Jun-26 | ~42 | ~46 | ~-4 |
| Jul-26 | ~50 | ~47 | ~3 |
| Aug-26 | ~65 | ~56 | ~9 |
| Early Sep-26 | ~68 | ~57 | ~11 |
| Mid Sep-26 | ~61 | ~50 | ~11 |
| Late Sep-26 | ~67 | ~52 | ~15 |
| Oct-26 | ~62 | ~47 | ~15 |
A note on sector classification
Is there any danger of AI-related bond issuance tipping the existing status quo of sector allocation within typical IG corporate indices? For example, ‘Banking’ currently makes up 21.5% of the FTSE US IG Corporate Index by market value weight (see Chart 7) and its sector weight has remained mostly stable over the last couple of years.
In contrast, the total weight of ‘Information & Data Technology’ in the FTSE US BIG Corporate Index has risen from 4.2% to 6.3% in the year from October 2025 to October 2026, making it the third-largest FTSE Russell corporate bond sector (COBS) after ‘Electric Utility’ (which has a 9.1% weight).
However, the fact that Amazon is considered a retail issuer under both the FTSE COBS and Thomson Reuters Business Sector (TRBC) classification schemes, while the other four hyperscalers are classified as technology issuers (‘Information & Data Technology’ under FTSE COBS and ‘Software & IT Services’ under TRBC Business Sector) is a strong illustration that a simple sector grouping could lead investors to miss parts of the chosen cohort.
Chart 6 (Left): Top-level sector, index weight (%) and chart 7 (right): top 20 corporate bond sector (COBS), index weight (%)
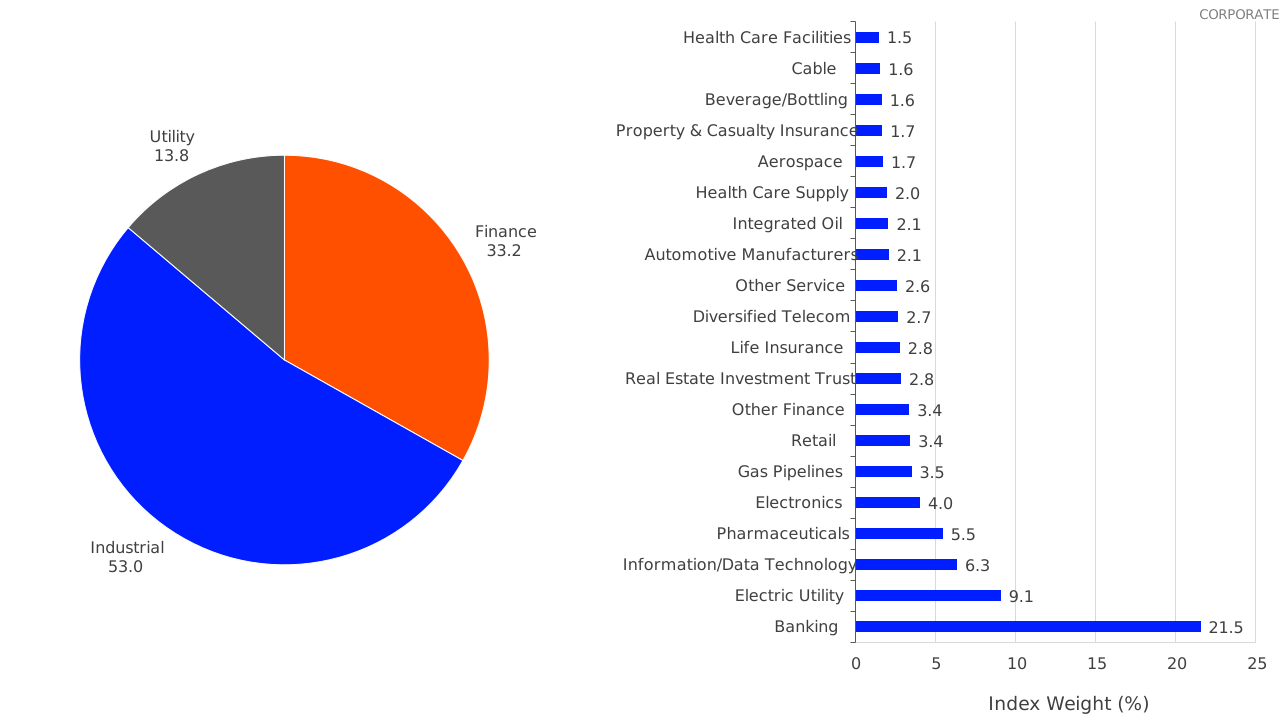
Source: FTSE Russell, 31 August 2026. Top 20 COBS sector codes represent 81% of the index by market value weight. Past performance is not a guide to future returns. Please see the end for important legal disclosures.
(Left) Chart 6: Top-level sector, index weight (%)
| Sector | Share (%) |
|---|---|
| Industrial | 70.9 |
| Finance | 32.5 |
| Utility | 13.9 |
(Right) Chart 7: Top 20 Corporate Bond Sector (COBS) index weight (%).
| Industry | Allocation (%) |
|---|---|
| Banking | 21.2 |
| Electric Utility | 9.1 |
| Information/Data Technology | 6.2 |
| Pharmaceuticals | 5.5 |
| Electronics | 4.0 |
| Gas Pipelines | 3.6 |
| Retail | 3.5 |
| Other Finance | 3.4 |
| Real Estate Investment Trust | 2.8 |
| Life Insurance | 2.8 |
| Diversified Telecom | 2.7 |
| Other Service | 2.6 |
| Integrated Oil | 2.1 |
| Health Care Supply | 2.0 |
| Automotive Manufacturers | 2.0 |
| Aerospace | 1.7 |
| Beverage/Bottling | 1.6 |
| Cable | 1.6 |
| Property & Casualty Insurance | 1.5 |
| Health Care Facilities | 1.5 |
Additionally, while these 5 hyperscalers currently remain the largest source of AI-themed bond issuance, such issuance is likely to show up more broadly over time in a variety of sectors: for example, technology, communication services, utilities, infrastructure, data centres, telecoms and some industrials. New research into identifying those infrastructure suppliers, applications/platforms and adopters will be required to help investors allocate accurately to this fixed income market theme.
What does this mean for fixed income indices?
If hyperscalers’ share within IG corporate benchmarks continues to grow, their spread moves will contribute more to indices’ headline performance, whether positively or negatively. A clear general implication is the need for clearer exposure measurement and a thoughtful, deliberate choice of benchmark. Indices need to have the supporting data for different types of investors: those requiring broad beta, those concerned about concentration constraints and those seeking deliberate thematic exposure to AI.
By design, market value-weighted bond indices assign larger weights to issuers with more eligible debt. While this generally provides liquidity, diversification can no longer be an automatic assumption. Previous research from FTSE Russell highlights the growing importance of alternatively weighted bond indices, like the FTSE Debt Capacity World Government Bond Index (DCWGBI), which adjusts market value weights using debt capacity measures.
To construct a fixed income index that allows investors targeted, direct exposure to all AI-themed issuers, new sector classifications that adequately capture the diverse nature of these businesses will be required. More granular, equity-like sector classifications, such as the TRBC sector classifications, could be a more effective tool for thematic investment in fixed income – but alone, they risk missing out key names in the AI ecosystem.
Either way, the demand for more complex, nuanced fixed income index solutions for passive investment strategies has never been greater.
footnotes
[1] https://am.jpmorgan.com/gb/en/asset-management/liq/insights/market-insights/market-updates/on-the-minds-of-investors/hyperscaler-debt-issuance-ai-buildout/?utm_source=chatgpt.com | Back to Note 1
[2] For this analysis, ‘hyperscalers’ refers to Amazon, Alphabet, Meta, Microsoft and Oracle, the five large cloud and AI-platform companies investing in computing infrastructure at scale.. | Back to Note 2
[3] Hyperscalers: Now also a credit story | J.P. Morgan Asset Management | Bank of England | Back to Note 3
[4] https://www.jpmorgan.com/insights/banking/capital-markets/financing-ai-infrastructure-data-centers | Back to Note 4
[5] FTSE US Broad Investment Grade Bond index, FTSE Pan-Euro Broad Investment Grade Bond index, FTSE Australian Broad Investment-Grade Bond index, FTSE Canada Universe Bond index, FTSE Japanese Broad Investment-Grade Bond index (FTSE USBIG, FTSE Pan-EuroBIG, FTSE AUSBIG, FTSE JPBIG and FTSE Canada Universe) | Back to Note 5
[6] https://www.insightinvestment.com/australia/perspectives/three-ai-related-fixed-income-ideas/ | Back to Note 6

Disclaimer
© [2026] London Stock Exchange Group plc and its applicable group undertakings (“LSEG”). LSEG includes (1) FTSE International Limited (“FTSE”), (2) Frank Russell Company (“Russell”), (3) FTSE Global Debt Capital Markets Inc. “FTSE Canada”, (4) FTSE Fixed Income LLC (“FTSE FI”), (5) FTSE (Beijing) Consulting Limited (“WOFE”), (6) FTSE EU SAS ("FES"). All rights reserved.
FTSE Russell® is a trading name of FTSE, Russell, FTSE Canada, FTSE FI, WOFE, FTSE EU and other LSEG entities providing LSEG Benchmark and Index services. “FTSE®”, “Russell®”, “FTSE Russell®”, “FTSE4Good®”, “ICB®”, “Refinitiv”, “WMR™” “FR™” and all other trademarks and service marks used herein (whether registered or unregistered) are trademarks and/or service marks owned or licensed by the applicable member of LSEG or their respective licensors.
FTSE International Limited is authorised as a Benchmark Administrator and regulated in the United Kingdom (UK) by the Financial Conduct Authority ("FCA") according to the UK Benchmark Regulation, FCA Reference Number 796803. FTSE EU SAS is authorised as Benchmark Administrator and regulated in the European Union (EU) by the Autorité des Marches Financiers (“AMF”) according to the EU Benchmark Regulation.
All information is provided for information purposes only. All information and data contained in this publication is obtained by LSEG, from sources believed by it to be accurate and reliable. Because of the possibility of human and mechanical inaccuracy as well as other factors, however, such information and data is provided "as is" without warranty of any kind. No member of LSEG nor their respective directors, officers, employees, partners or licensors make any claim, prediction, warranty or representation whatsoever, expressly or impliedly, either as to the accuracy, timeliness, completeness, merchantability of any information or LSEG Products, or of results to be obtained from the use of LSEG products, including but not limited to indices, rates, data and analytics, or the fitness or suitability of the LSEG products for any particular purpose to which they might be put. The user of the information assumes the entire risk of any use it may make or permit to be made of the information.
No responsibility or liability can be accepted by any member of LSEG nor their respective directors, officers, employees, partners or licensors for (a) any loss or damage in whole or in part caused by, resulting from, or relating to any inaccuracy (negligent or otherwise) or other circumstance involved in procuring, collecting, compiling, interpreting, analysing, editing, transcribing, transmitting, communicating or delivering any such information or data or from use of this document or links to this document or (b) any direct, indirect, special, consequential or incidental damages whatsoever, even if any member of LSEG is advised in advance of the possibility of such damages, resulting from the use of, or inability to use, such information.
No member of LSEG nor their respective directors, officers, employees, partners or licensors provide investment advice and nothing in this document should be taken as constituting financial or investment advice. No member of LSEG nor their respective directors, officers, employees, partners or licensors make any representation regarding the advisability of investing in any asset or whether such investment creates any legal or compliance risks for the investor. A decision to invest in any such asset should not be made in reliance on any information herein. Indices and rates cannot be invested in directly. Inclusion of an asset in an index or rate is not a recommendation to buy, sell or hold that asset nor confirmation that any particular investor may lawfully buy, sell or hold the asset or an index or rate containing the asset. The general information contained in this publication should not be acted upon without obtaining specific legal, tax, and investment advice from a licensed professional.
Past performance is no guarantee of future results. Charts and graphs are provided for illustrative purposes only. Index and/or rate returns shown may not represent the results of the actual trading of investable assets. Certain returns shown may reflect back-tested performance. All performance presented prior to the index or rate inception date is back-tested performance. Back-tested performance is not actual performance, but is hypothetical. The back-test calculations are based on the same methodology that was in effect when the index or rate was officially launched. However, back-tested data may reflect the application of the index or rate methodology with the benefit of hindsight, and the historic calculations of an index or rate may change from month to month based on revisions to the underlying economic data used in the calculation of the index or rate.
This document may contain forward-looking assessments. These are based upon a number of assumptions concerning future conditions that ultimately may prove to be inaccurate. Such forward-looking assessments are subject to risks and uncertainties and may be affected by various factors that may cause actual results to differ materially. No member of LSEG nor their licensors assume any duty to and do not undertake to update forward-looking assessments.
No part of this information may be reproduced, stored in a retrieval system or transmitted in any form or by any means, electronic, mechanical, photocopying, recording or otherwise, without prior written permission of the applicable member of LSEG. Use and distribution of LSEG data requires a licence from LSEG and/or its licensors.