

Lee Clements
Key Findings
- Eighty-four percent of asset owners are incorporating SI, up from 73% in 2025 and close to the previous high in 2022
- They are applying them to a larger proportion of assets, 55% in 2026, up from 41% in 2025
- Governance, tax and shareholder rights have risen sharply in 2026 to be the most cited priority issue at 32%, whilst climate (both transition and physical issues) were also seen as key
- Concerns around financial performance, ESG data and greenwashing are falling as barriers to SI adoption, whilst costs and corporate reporting concerns are rising
Although sustainable investment has faced headwinds in recent years, findings from FTSE Russell’s ninth annual Sustainable Investment Asset Owner Survey suggest adoption is moving back toward previous highs, while sustainability considerations continue to become more integrated into the day-to-day investment process. Drawing on input from more than 400 asset owners across 24 countries, this year’s survey provides a global view of how sustainable investment priorities and practices are evolving.
Sustainable investment moves back toward previous highs
The share of asset owners incorporating sustainability considerations into their investment strategies rose notably in 2026. Eighty-four percent of respondents now take sustainability considerations into account in some form, up from 73% in 2025 and just two percentage points below the survey’s previous high of 86% in 2022. A further 15% are currently evaluating whether to incorporate sustainability considerations into their investment strategies.
The dip in the percentage of investors taking sustainability considerations into account has reversed
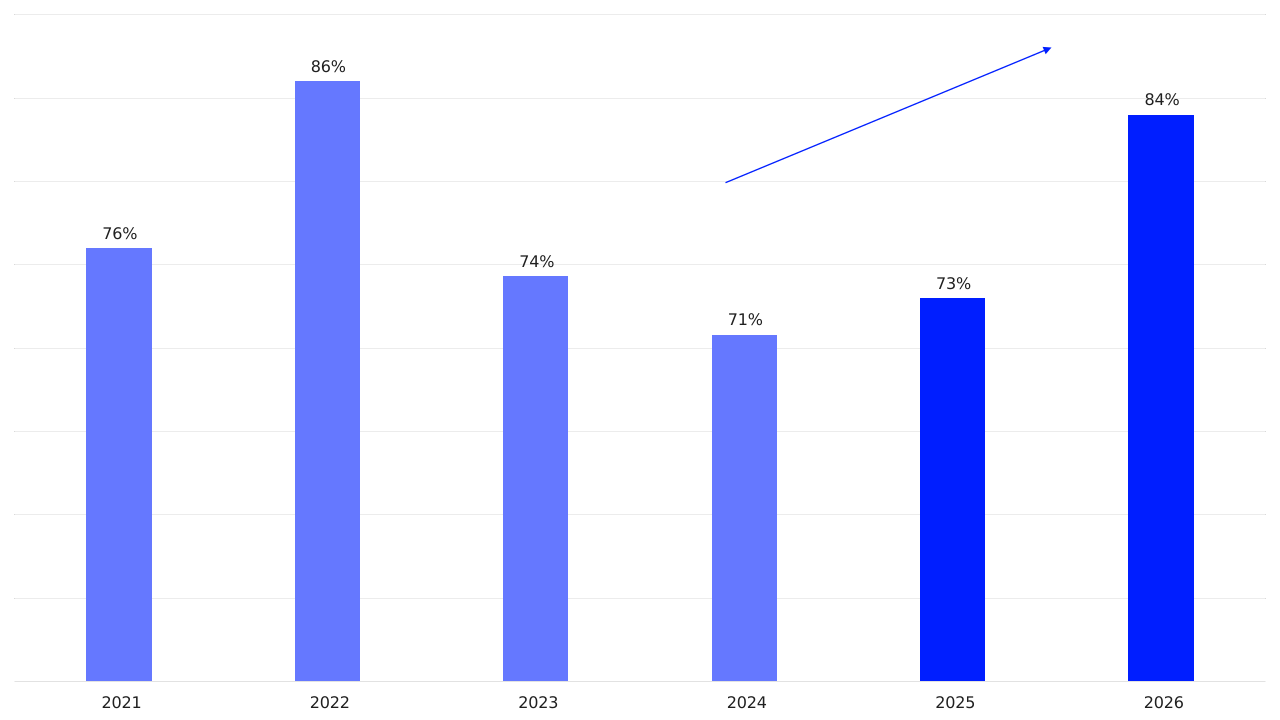
Source: FTSE Russell Sustainable Asset Owner Survey 2026. Past performance is not a guide to future returns. Please see the end for important legal disclosures.
Percentage of asset owners implementing sustainability considerations in their investment strategy.
| 2021 | 2022 | 2023 | 2024 | 2025 | 2026 |
|---|---|---|---|---|---|
| 76.00% | 86.00% | 74.30% | 70.80% | 73% | 84% |
Sustainability considerations are also extending across a larger share of portfolios. In 2026, 51% of surveyed asset owners apply sustainability considerations to a majority of their overall assets, up notably from 26% last year. 11% now apply them across their entire portfolios.
Integration of sustainability factors across portfolios is growing deeper
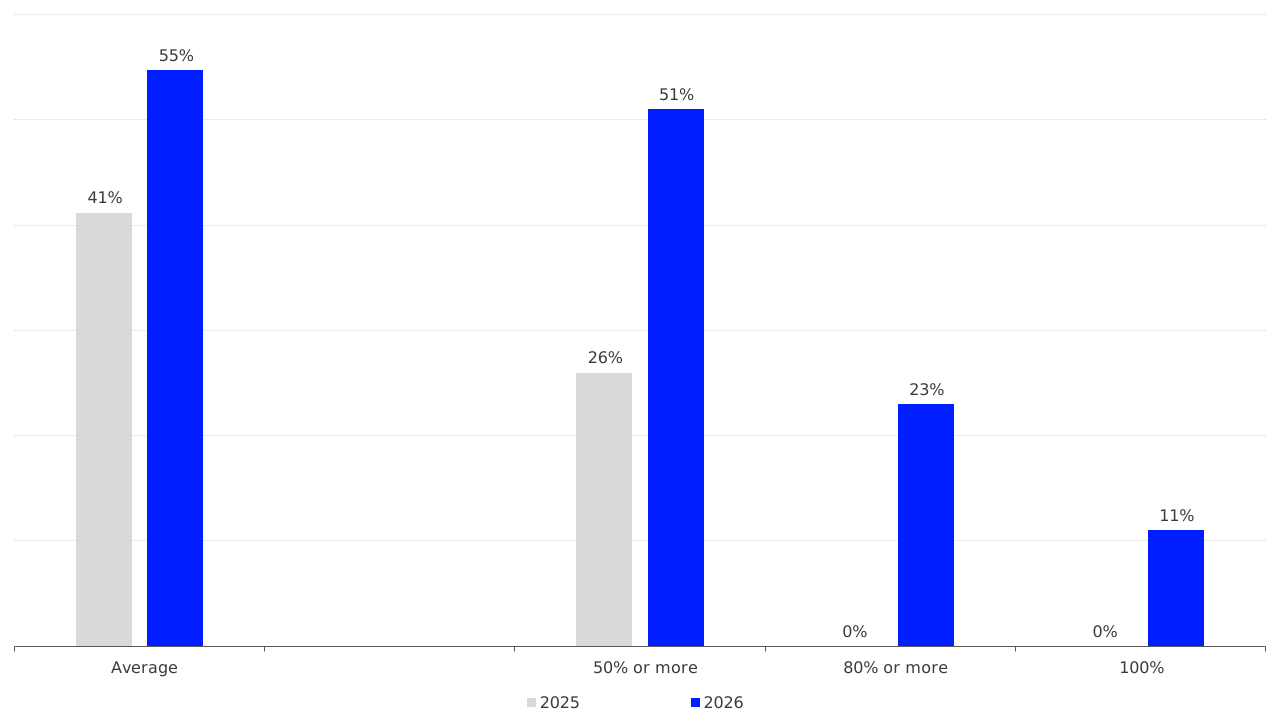
Source: FTSE Russell Sustainable Asset Owner Survey 2026. Past performance is not a guide to future returns. Please see the end for important legal disclosures.
Percentage of the organisation’s overall active and passive portfolio currently implementing sustainability considerations
| 2025 | 2026 | |
|---|---|---|
| Average | 41% | 55% |
| 50% or more | 26% | 51% |
| 80% or more | 0% | 23% |
| 100% | 0% | 11% |
The findings indicate that surveyed asset owners are applying sustainability consideration across a broader share of their mainstream portfolios. The evolution is particularly evident in listed equities, the most mature asset class for sustainable investment implementation: The proportion of surveyed asset owners applying sustainability considerations to listed equities rose from 59% in 2025 to 71% this year.
Governance and physical climate risk move up the agenda
Governance, tax and shareholder rights featured more prominently in asset owners’ sustainability agendas in 2026, cited as a priority by 32% of respondents, compared with 18% last year. The survey points to a heightened focus on the quality of governance and shareholder rights against a backdrop of market uncertainty, geopolitical tensions and the artificial intelligence revolution.
Governance and physical climate are seen as large and growing risks by asset owners
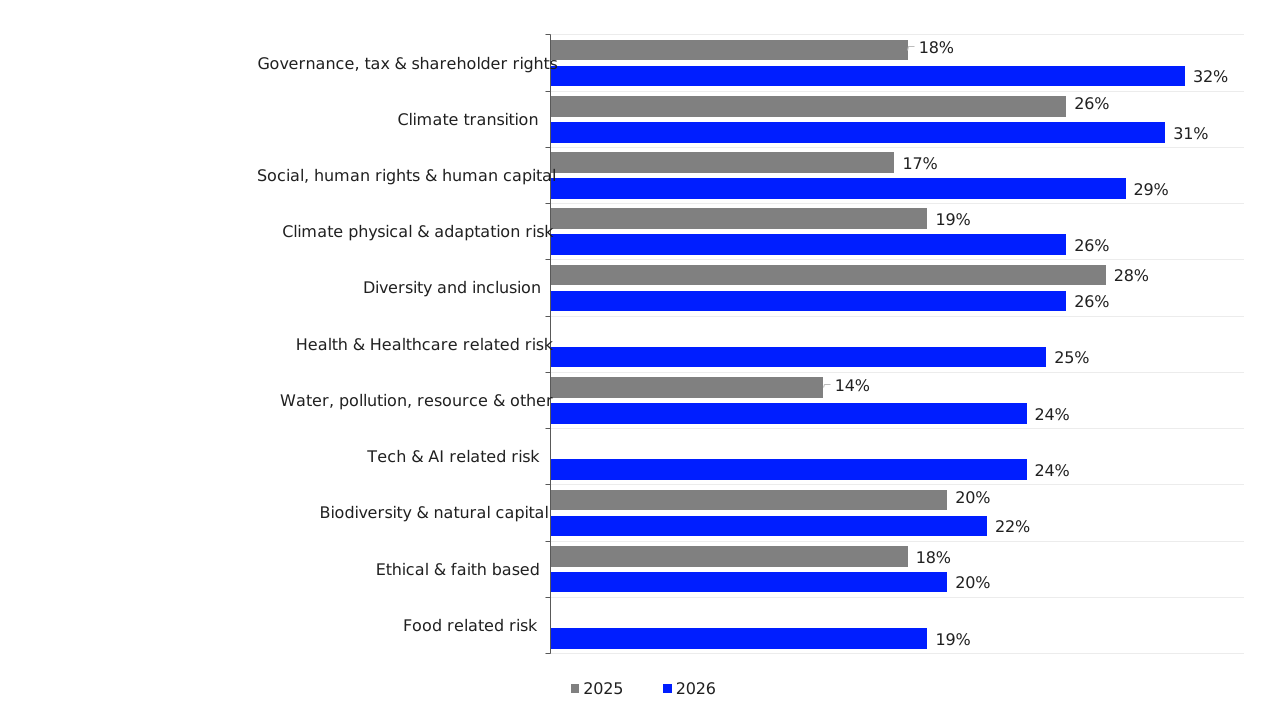
Source: FTSE Russell Sustainable Asset Owner Survey 2026. Past performance is not a guide to future returns. Please see the end for important legal disclosures.
Sustainability issues considered a priority focus; new categories for 2026 (Health, Tech and Food) all have a zero for 2025; categories which have been amalgamated have the average figures of the previous categories for 2025
| 2025 | 2026 | |
|---|---|---|
| Governance, tax & shareholder rights | 18% | 32% |
| Climate transition | 26% | 31% |
| Social, human rights & human capital | 17% | 29% |
| Climate physical & adaptation risk | 19% | 26% |
| Diversity and inclusion | 28% | 26% |
| Health & Healthcare related risk | - | 25% |
| Water, pollution, resource & other | 14% | 24% |
| Tech & AI related risk | - | 24% |
| Biodiversity & natural capital | 20% | 22% |
| Ethical & faith based | 18% | 20% |
| Food related risk | - | 19% |
Climate risks also moved up the agenda. Amid continued disruption in global energy markets and the increasingly visible effects associated with rising temperatures, physical climate and adaptation risk was identified as a priority by 26% of asset owners, up from 19% in 2025. Concern about the investment impact of climate risk has also intensified: one-quarter of respondents rated their concern at 10 out of 10, compared with 11% last year.
Corporate reporting and costs come into sharper focus
Asset owners are increasingly focused on the investment case for sustainable investment. Nearly half (47%) of respondents say their organisation pursues sustainable investment to improve portfolio returns, up from 41% in 2025. At the same time, the share citing concerns about financial performance as a barrier to sustainable investment fell from 27% to 19%.
Cost is also becoming a more prominent consideration. A quarter of asset owners now identify costs as a barrier to greater sustainable investment adoption, compared with 17% last year. Meanwhile, some of the concerns that have featured prominently in previous surveys have receded: ESG data availability fell from 36% to 25% as a cited barrier, while concerns about greenwashing dropped from 37% to 22%. The quality or consistency of corporate reporting and disclosures emerged as the most cited barrier to further adoption.
Greenwashing, data and performance barriers falling, while reporting, fiduciary and cost concerns remain large and/or rising
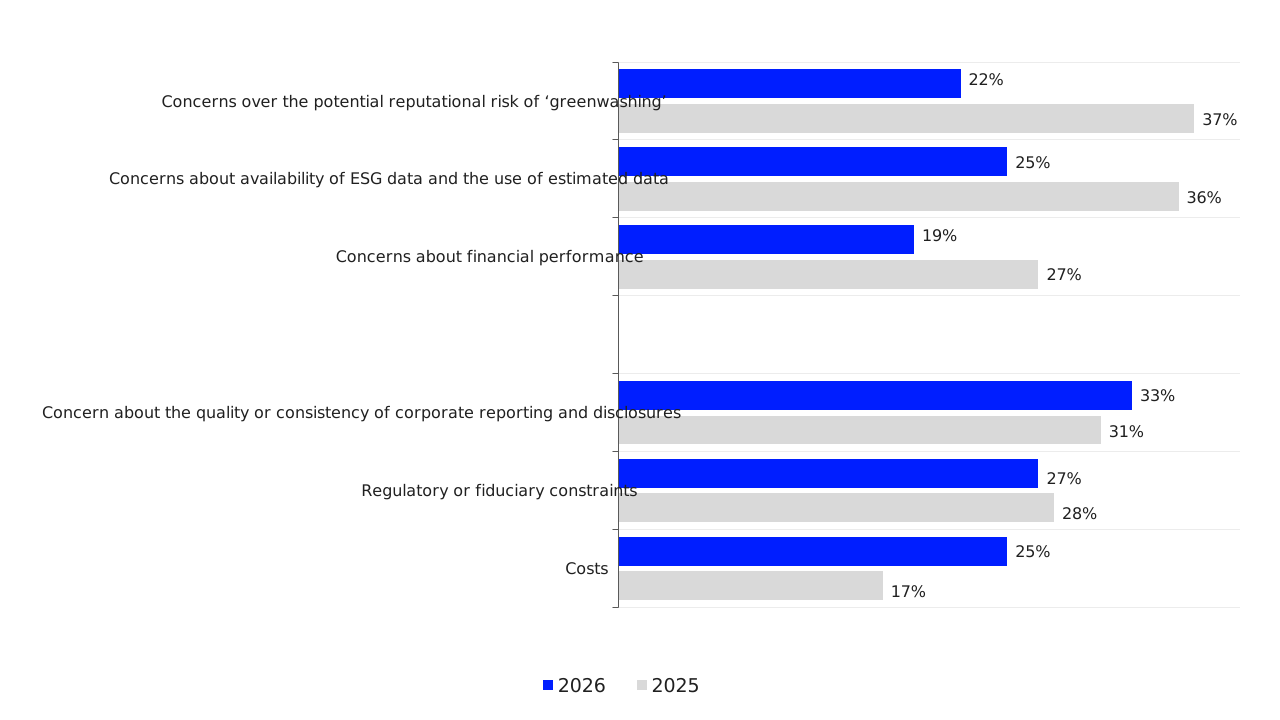
Source: FTSE Russell Sustainable Asset Owner Survey 2026. Past performance is not a guide to future returns. Please see the end for important legal disclosures.
Perceived barriers to increased sustainable investment adoption across asset classes (percentage of asset owners)
| 2025 | 2026 | |
|---|---|---|
| Concerns over the potential reputational risk of ‘greenwashing’ | 37% | 22% |
| Concerns about availability of ESG data and the use of estimated data | 36% | 25% |
| Concerns about financial performance | 27% | 19% |
| Concern about the quality or consistency of corporate reporting and disclosures | 31% | 33% |
| Regulatory or fiduciary constraints | 28% | 27% |
| Costs | 17% | 25% |
Overall, this year’s findings suggest sustainability considerations are becoming more deeply embedded in investment practice as asset owners weigh their implications for risk and returns. Explore the full 2026 Sustainable Investment Asset Owner Survey report to learn more about how asset owners’ priorities and approaches are evolving.
About the 2026 survey
We received responses from 402 asset owners from 24 countries, in three regions: Asia Pacific (30%), EMEA (40%) and North America (30%). Respondents were all senior members of sustainability, investment or management teams. The respondents were from a range of asset owner types: 45% pension funds, 15% insurance companies, 15% government-related and sovereign wealth funds, 18% endowments, foundations and family offices, and 7% other. Around 22% of respondents have assets under management (AUM) of US$100 billion or more, 48% have AUM of US$1 billion to US$100 billion, and 30% have AUM of less than US$1 billion.


Disclaimer
© [2026] London Stock Exchange Group plc and its applicable group undertakings (“LSEG”). LSEG includes (1) FTSE International Limited (“FTSE”), (2) Frank Russell Company (“Russell”), (3) FTSE Global Debt Capital Markets Inc. “FTSE Canada”, (4) FTSE Fixed Income LLC (“FTSE FI”), (5) FTSE (Beijing) Consulting Limited (“WOFE”), (6) FTSE EU SAS ("FES"). All rights reserved.
FTSE Russell® is a trading name of FTSE, Russell, FTSE Canada, FTSE FI, WOFE, FTSE EU and other LSEG entities providing LSEG Benchmark and Index services. “FTSE®”, “Russell®”, “FTSE Russell®”, “FTSE4Good®”, “ICB®”, “Refinitiv”, “WMR™” “FR™” and all other trademarks and service marks used herein (whether registered or unregistered) are trademarks and/or service marks owned or licensed by the applicable member of LSEG or their respective licensors.
FTSE International Limited is authorised as a Benchmark Administrator and regulated in the United Kingdom (UK) by the Financial Conduct Authority ("FCA") according to the UK Benchmark Regulation, FCA Reference Number 796803. FTSE EU SAS is authorised as Benchmark Administrator and regulated in the European Union (EU) by the Autorité des Marches Financiers (“AMF”) according to the EU Benchmark Regulation.
All information is provided for information purposes only. All information and data contained in this publication is obtained by LSEG, from sources believed by it to be accurate and reliable. Because of the possibility of human and mechanical inaccuracy as well as other factors, however, such information and data is provided "as is" without warranty of any kind. No member of LSEG nor their respective directors, officers, employees, partners or licensors make any claim, prediction, warranty or representation whatsoever, expressly or impliedly, either as to the accuracy, timeliness, completeness, merchantability of any information or LSEG Products, or of results to be obtained from the use of LSEG products, including but not limited to indices, rates, data and analytics, or the fitness or suitability of the LSEG products for any particular purpose to which they might be put. The user of the information assumes the entire risk of any use it may make or permit to be made of the information.
No responsibility or liability can be accepted by any member of LSEG nor their respective directors, officers, employees, partners or licensors for (a) any loss or damage in whole or in part caused by, resulting from, or relating to any inaccuracy (negligent or otherwise) or other circumstance involved in procuring, collecting, compiling, interpreting, analysing, editing, transcribing, transmitting, communicating or delivering any such information or data or from use of this document or links to this document or (b) any direct, indirect, special, consequential or incidental damages whatsoever, even if any member of LSEG is advised in advance of the possibility of such damages, resulting from the use of, or inability to use, such information.
No member of LSEG nor their respective directors, officers, employees, partners or licensors provide investment advice and nothing in this document should be taken as constituting financial or investment advice. No member of LSEG nor their respective directors, officers, employees, partners or licensors make any representation regarding the advisability of investing in any asset or whether such investment creates any legal or compliance risks for the investor. A decision to invest in any such asset should not be made in reliance on any information herein. Indices and rates cannot be invested in directly. Inclusion of an asset in an index or rate is not a recommendation to buy, sell or hold that asset nor confirmation that any particular investor may lawfully buy, sell or hold the asset or an index or rate containing the asset. The general information contained in this publication should not be acted upon without obtaining specific legal, tax, and investment advice from a licensed professional.
Past performance is no guarantee of future results. Charts and graphs are provided for illustrative purposes only. Index and/or rate returns shown may not represent the results of the actual trading of investable assets. Certain returns shown may reflect back-tested performance. All performance presented prior to the index or rate inception date is back-tested performance. Back-tested performance is not actual performance, but is hypothetical. The back-test calculations are based on the same methodology that was in effect when the index or rate was officially launched. However, back-tested data may reflect the application of the index or rate methodology with the benefit of hindsight, and the historic calculations of an index or rate may change from month to month based on revisions to the underlying economic data used in the calculation of the index or rate.
This document may contain forward-looking assessments. These are based upon a number of assumptions concerning future conditions that ultimately may prove to be inaccurate. Such forward-looking assessments are subject to risks and uncertainties and may be affected by various factors that may cause actual results to differ materially. No member of LSEG nor their licensors assume any duty to and do not undertake to update forward-looking assessments.
No part of this information may be reproduced, stored in a retrieval system or transmitted in any form or by any means, electronic, mechanical, photocopying, recording or otherwise, without prior written permission of the applicable member of LSEG. Use and distribution of LSEG data requires a licence from LSEG and/or its licensors.