

Julian Whitaker

David McNay, CFA
Key takeaways
- Last week we saw a significant spike in the Japanese yen following a joint Japan/US intervention in the currency market.
- It is reasonable to expect further near-term volatility in the spot rate.
- Historically, currency-hedged returns have performed better than unhedged returns during periods of heightened USD/JPY spot volatility.
In “Time for an intervention”, we noted that the coordinated late-July intervention by the US and Japanese authorities had weaponised volatility, resulting in a 5 standard deviation spike in the dollar-yen spot rate. The potential for a further large directional move in the yen implies that investors should be deliberate about their FX exposure.
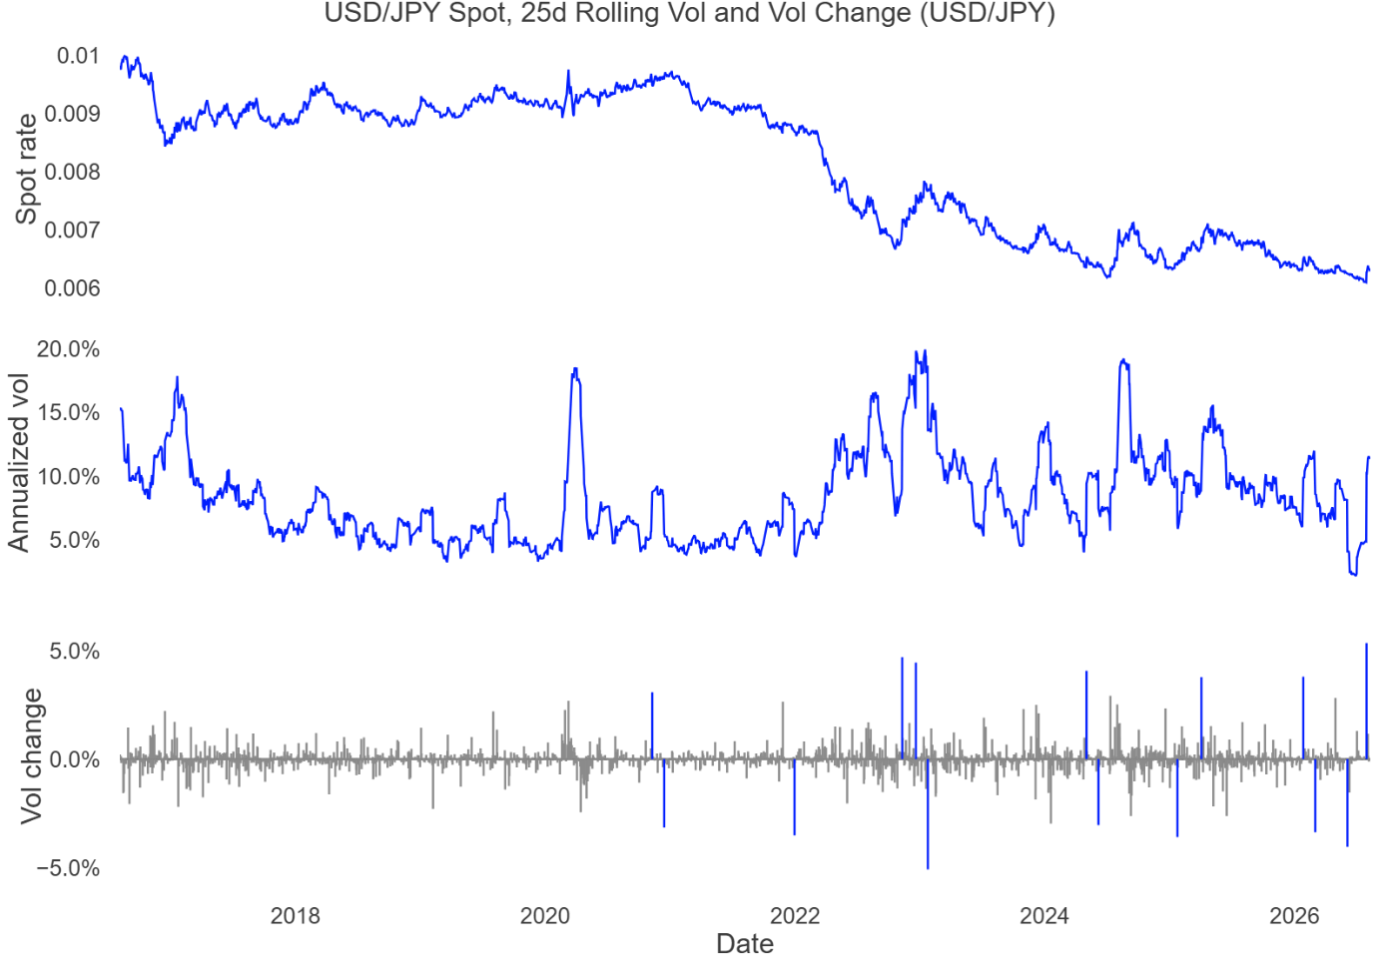
Figure 1: USD/JPY Spot, rolling 20d spot volatility and volatility change since 2016.
Source: FTSE Russell, data to August 9, 2026. Past performance is not a guide to future returns. Please see the end for important legal disclosures.
That isn’t to say that investors need to change their strategies. Conventional wisdom is that foreign equity exposures should be unhedged and that currency movements wash out over time. In other words, investors should accept an implicit long position in international currency.
However, given recent volatility, investors should ask themselves explicitly if they want to assume the FX risk. Do they want to hedge it? Or should they take a more ‘neutral’ view and use a partial hedge?
How FX volatility has affected Japanese equity returns
Following the recent spike in the yen, it is reasonable to expect further short-term volatility in the USD/JPY currency pair. There are arguments for the yen both strengthening and weakening: a cheap yen, recent Japanese rate hikes and the possibility of continued FX interventions support a bullish case; persistent yield differentials and expansionary fiscal policy in Japan favour the bearish case.
Looking top-down at the history of this important currency pair and comparing past hedged and unhedged returns, we can contrast returns during periods of low, medium and high spot rate volatility.
Here, we define low-, medium- and high-volatility periods by comparing the rolling 25-day realised volatility of daily spot returns to the 5-year trailing average (with the medium-volatility band being ±0.5 standard deviations around the trailing baseline).
In the chart, the blue shaded areas mark periods of high volatility, the white areas mark periods of medium volatility and the green areas mark periods of low volatility.
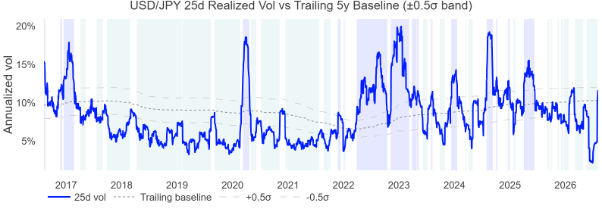
Figure 2a: Spot volatility with trailing 5Y mean categorising low and high vol periods.
Source: FTSE Russell, data to August 9, 2026. Past performance is not a guide to future returns. Please see the end for important legal disclosures.
Over the observation period, the number of low-volatility observations (47% of the sample) was higher than the number of medium-volatility observations (33%), which in turn was higher than the number of high-volatility observations (20%). This is representative of the clustering of volatility we typically see when observing financial market returns.
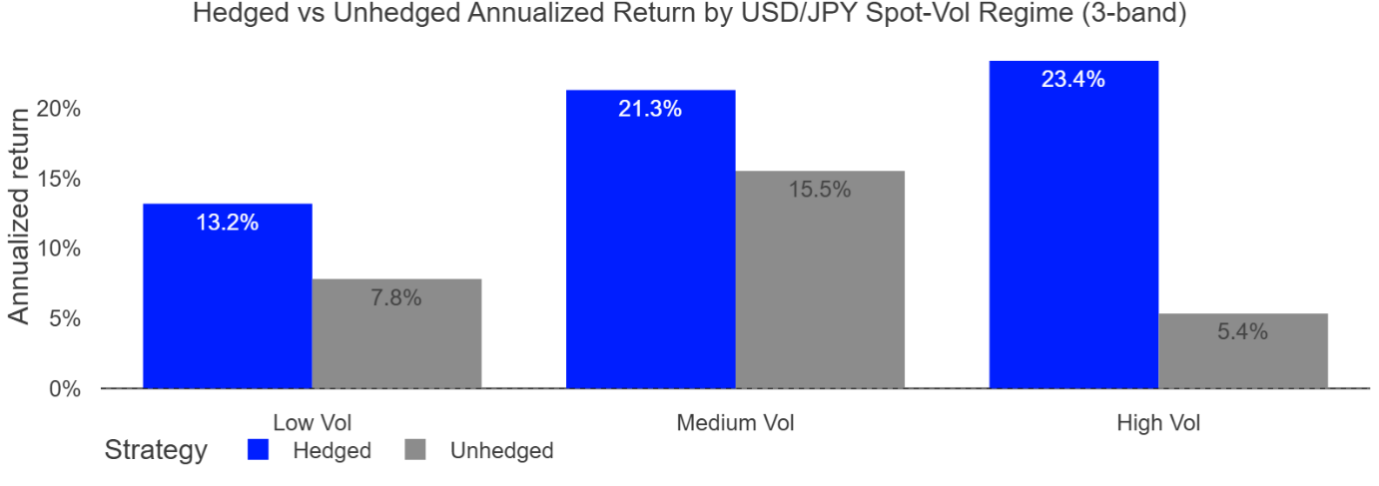
Figure 2b: Average annualised return of hedged vs unhedged FTSE Japan Index during low- and high-volatility periods defined in Figure 2a.
Source: FTSE Russell, data to August 9, 2026. Past performance is not a guide to future returns. Please see the end for important legal disclosures.
How has this affected the returns from Japanese equities for a US dollar-based investor? Since 2016, dollar-hedged Japanese equities have delivered higher average returns than their unhedged counterparts across all three volatility regimes.
The difference was particularly pronounced when USD/JPY volatility was elevated: in the high-volatility regime, annualised returns averaged 23.4% for the hedged index, compared with a 5.4% return from the unhedged index.
This does not imply that higher volatility causes hedging to outperform per se. Hedging profit (or loss) arises from the spot rate moving more (or less) than the carry implied by the hedging instrument. However, we can conclude that over this period the historical benefit from hedging was considerably greater when spot foreign exchange volatility was elevated.
Conclusion
Currency hedging is a valuable tool for international investors. Since the yen peaked in 2011, foreign investors in Japanese assets would have benefited from hedging, either from the perspective of return enhancement or volatility reduction. As well as removing yen currency risk, foreign investors earned positive carry from hedging, reflecting the large interest rate differential between the Bank of Japan’s and the Federal Reserve’s policy rates. While this gap has narrowed, it continues to exist.
Considering recent FX movements, our analysis implies that currency hedging has proved especially valuable during periods of heightened spot volatility, highlighting the importance of investors managing their currency exposure in international portfolios explicitly, not implicitly. In a follow-up piece, we will explore the application of partial hedge ratios to achieve a variety of investment objectives, including volatility reduction. We will also broaden the analysis to include a wider selection of currency pairs and equity portfolios containing multiple constituent currencies.


Disclaimer
© [2026] London Stock Exchange Group plc and its applicable group undertakings (“LSEG”). LSEG includes (1) FTSE International Limited (“FTSE”), (2) Frank Russell Company (“Russell”), (3) FTSE Global Debt Capital Markets Inc. “FTSE Canada”, (4) FTSE Fixed Income LLC (“FTSE FI”), (5) FTSE (Beijing) Consulting Limited (“WOFE”), (6) FTSE EU SAS ("FES"). All rights reserved.
FTSE Russell® is a trading name of FTSE, Russell, FTSE Canada, FTSE FI, WOFE, FTSE EU and other LSEG entities providing LSEG Benchmark and Index services. “FTSE®”, “Russell®”, “FTSE Russell®”, “FTSE4Good®”, “ICB®”, “Refinitiv”, “WMR™” “FR™” and all other trademarks and service marks used herein (whether registered or unregistered) are trademarks and/or service marks owned or licensed by the applicable member of LSEG or their respective licensors.
FTSE International Limited is authorised as a Benchmark Administrator and regulated in the United Kingdom (UK) by the Financial Conduct Authority ("FCA") according to the UK Benchmark Regulation, FCA Reference Number 796803. FTSE EU SAS is authorised as Benchmark Administrator and regulated in the European Union (EU) by the Autorité des Marches Financiers (“AMF”) according to the EU Benchmark Regulation.
All information is provided for information purposes only. All information and data contained in this publication is obtained by LSEG, from sources believed by it to be accurate and reliable. Because of the possibility of human and mechanical inaccuracy as well as other factors, however, such information and data is provided "as is" without warranty of any kind. No member of LSEG nor their respective directors, officers, employees, partners or licensors make any claim, prediction, warranty or representation whatsoever, expressly or impliedly, either as to the accuracy, timeliness, completeness, merchantability of any information or LSEG Products, or of results to be obtained from the use of LSEG products, including but not limited to indices, rates, data and analytics, or the fitness or suitability of the LSEG products for any particular purpose to which they might be put. The user of the information assumes the entire risk of any use it may make or permit to be made of the information.
No responsibility or liability can be accepted by any member of LSEG nor their respective directors, officers, employees, partners or licensors for (a) any loss or damage in whole or in part caused by, resulting from, or relating to any inaccuracy (negligent or otherwise) or other circumstance involved in procuring, collecting, compiling, interpreting, analysing, editing, transcribing, transmitting, communicating or delivering any such information or data or from use of this document or links to this document or (b) any direct, indirect, special, consequential or incidental damages whatsoever, even if any member of LSEG is advised in advance of the possibility of such damages, resulting from the use of, or inability to use, such information.
No member of LSEG nor their respective directors, officers, employees, partners or licensors provide investment advice and nothing in this document should be taken as constituting financial or investment advice. No member of LSEG nor their respective directors, officers, employees, partners or licensors make any representation regarding the advisability of investing in any asset or whether such investment creates any legal or compliance risks for the investor. A decision to invest in any such asset should not be made in reliance on any information herein. Indices and rates cannot be invested in directly. Inclusion of an asset in an index or rate is not a recommendation to buy, sell or hold that asset nor confirmation that any particular investor may lawfully buy, sell or hold the asset or an index or rate containing the asset. The general information contained in this publication should not be acted upon without obtaining specific legal, tax, and investment advice from a licensed professional.
Past performance is no guarantee of future results. Charts and graphs are provided for illustrative purposes only. Index and/or rate returns shown may not represent the results of the actual trading of investable assets. Certain returns shown may reflect back-tested performance. All performance presented prior to the index or rate inception date is back-tested performance. Back-tested performance is not actual performance, but is hypothetical. The back-test calculations are based on the same methodology that was in effect when the index or rate was officially launched. However, back-tested data may reflect the application of the index or rate methodology with the benefit of hindsight, and the historic calculations of an index or rate may change from month to month based on revisions to the underlying economic data used in the calculation of the index or rate.
This document may contain forward-looking assessments. These are based upon a number of assumptions concerning future conditions that ultimately may prove to be inaccurate. Such forward-looking assessments are subject to risks and uncertainties and may be affected by various factors that may cause actual results to differ materially. No member of LSEG nor their licensors assume any duty to and do not undertake to update forward-looking assessments.
No part of this information may be reproduced, stored in a retrieval system or transmitted in any form or by any means, electronic, mechanical, photocopying, recording or otherwise, without prior written permission of the applicable member of LSEG. Use and distribution of LSEG data requires a licence from LSEG and/or its licensors.