

David McNay, CFA

Julian Whitaker
Key takeaways
- Japan and the US engaged in a co-ordinated intervention in the currency markets causing a 5-standard deviation [note1] move in Dollar-Yen.
- Authorities in Japan intervening in the currency markets is not unusual, what is different this time is a) coordination with the US Treasury department and b) weaponisation of volatility to disincentivise speculative trading.
- On a value basis the Yen is extremely cheap. But attractive valuations are battling a combination of expansionary fiscal policy and relatively divergent monetary policy, which would typically point to a weaker currency.
- Investors in Japanese equity are embedding a currency view into their positions by holding the equity hedged or unhedged; investors may want to ensure that view is deliberate.
- The FTSE Japan 100% Hedged index in USD has outperformed the unhedged index over 1, 3 and 5 years.
What happened?
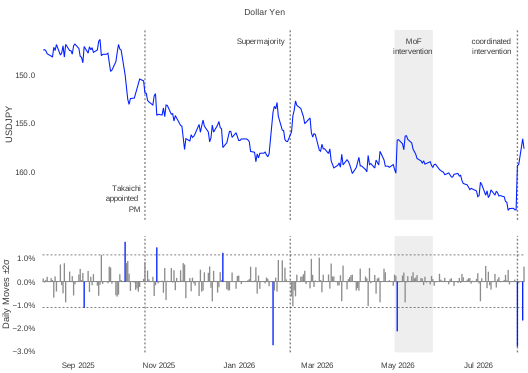
Figure 1: Dollar-Yen on an inverted scale with daily price moves and +/- 2 standard deviation bands.
Source: FTSE Russell, data to August 4, 2026. Past performance is not a guide to future returns. Please see the end for important legal disclosures.
The move was a co-ordinated intervention between the Japanese Ministry of Finance (MoF) and the US Treasury Department. In which as estimated [note2] ¥14tn ($88bn) were purchased over 2 trading sessions. Following the intervention, Japanese Finance Minister Satsuki Katayama stated “We will not hesitate to conduct further joint intervention.”; sentiment reiterated by Scott Bessent.
That the MoF is intervening in the currency markets is not unusual, records show that between 28 April – 27 May 2026 the MoF bought ¥11.74tn of JPY, and there were similar campaigns in 2024 [note3] . This campaign in unusual for two key reasons:
- Weaponisation of volatility
- Repo agreement with the US Treasury
Weaponisation of volatility
For this intervention a 5 standard deviation event was likely not an accident but an objective. The Yen is the 3rd most traded currency globally with $1.6 trillion of average daily over-the-counter (OTC) turnover according to the BIS [note4]. Put another way, the Yen is too big to be defended for a sustained period.
By running a large intervention over a short window the MoF can disincentivise geared macro bets by short term speculators by potentially ‘stopping out’ trades and making it more costly to engage if future bets.
Repo agreement with the US Treasury
What led us here?
In an earlier insight [note6] we noted that PM Takaichi is philosophically aligned to former PM Abe but that the economy she inherited is markedly different to the Japanese economy at the start of Abenomics. Specifically that there is no longer Yield Curve Control (YCC) anchoring the JGB curve, which meant that unlike during Abenomics fiscal policy and monetary policy may work against one another.
On a valuation basis the Yen is extremely weak [note7] which we can observe from the real effective exchange rate (REER) in Figure 2 which shows trade weighted currency adjusted for inflation, alongside the 10Y simple moving average.
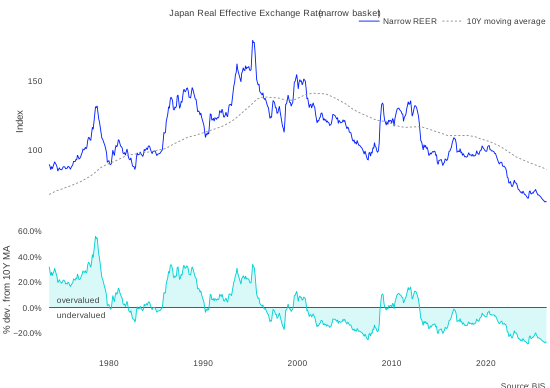
Figure 2: The Real Effective Exchange Rate (REER) with the 10Y moving average.
Source: BIS data to June 30, 2026. Past performance is not a guide to future returns. Please see the end for important legal disclosures.
But valuation faces a headwind of expansionary fiscal policy and a widening, relative, interest rate differentials with the US – which has been driven more by a more hawkish Fed rhetoric than it has by a significant policy change by the Bank of Japan (BoJ).
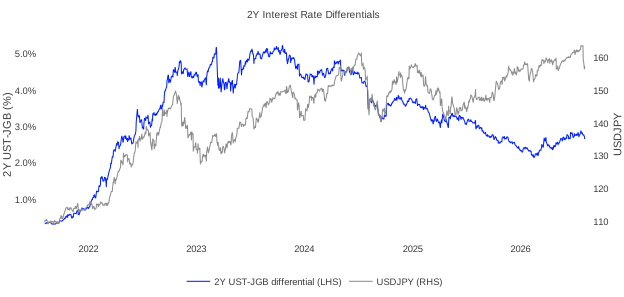
Figure 3: US and Japanese interest rate differentials and the USDJPY.
Source: FTSE Russell, data to August 4, 2026. Past performance is not a guide to future returns. Please see the end for important legal disclosures.
Who remembers the Abenomics trade?
More mature readers may remember the Abenomics trade, which was to take a long position in Japanese equity and to sell short the Yen. We won’t opine on the efficacy of the trade, other than to highlight that for the reasons outlined above the probability of a large shift – in either direction – of JPY is elevated and therefore equity are embedding a view on the Yen in their decision to hold Japanese equity hedged or unhedged.
Many investors are surprised by the magnitude of the performance differences between hedged and unhedged Japanese equity returns. Over 12M, the end-of-July, the FTSE Japan 100% Hedged index has outperformed the FTSE Japan index by 12.3ppts; over 3Y that spread is c. 43ppts.
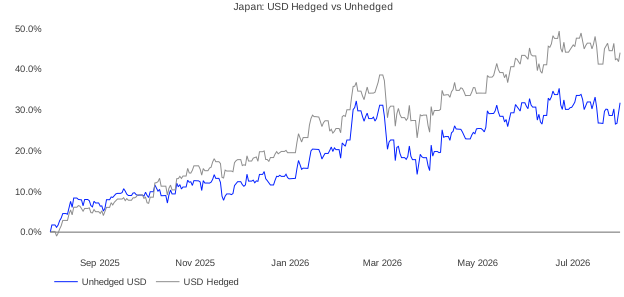
Figure 4: 12M performance of the FTSE Japan Index TR USD unhedged and the 100% hedged versions.
Source: FTSE Russell, data as of 31 July 2026. Past performance is not a guide to future returns. Please see the end for important legal disclosures.
In Much ado about hedging [note8], we noted that the primary objective of currency hedging is mitigating FX, which we can see from the 5Y drawdowns of the unhedged vs. 100% hedged FTSE Japan indices.
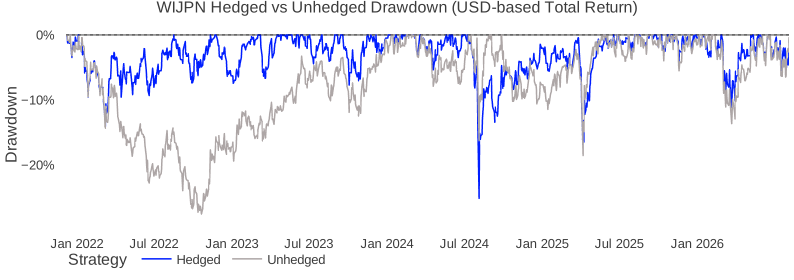
Figure 5: Drawdowns of FTSE Japan Index TR USD Unhedged vs 100% Hedged over the last 5Y.
Source: FTSE Russell data as of August 6, 2026. Past performance is not a guide to future returns. Please see the end for important legal disclosures.
In an upcoming insight we will dive into specifics of longer run risk / return characteristics of Japanese equity under different volatility regimes and consider if there was an optimal strategic hedge ratio.
Conclusion
Co-ordinated Yen intervention marked a change in strategy in how authorities are defending the Yen; joint intervention with the US was aimed at increasing volatility rather than reducing it.
Equity investors in Japan are embedding a currency view into their decisions. Given the potential for a meaningful directional shift – stronger or weaker – in the Yen it makes sense for that decision to be explicit rather than implicit. The performance differential is material with the hedged index outperforming by c. 12.3% and 43% over 12M and 3Y respectively.
footnotes
[1] Standard deviation calculated as 10 years of daily observations using WMR close prices to July 31, 2026 | Back to Note 1
[2] The real message in the yen intervention | Back to Note 2
[3] Japan Ministry of Finance data shows ¥5.54tn in July 2024, ¥9.80tn in April-May 2024 and ¥6.35tb in a campaign from October 2022 | Back to Note 3
[4] According the BIS Triennial Central Bank survey: https://www.bis.org/statistics/rpfx25.htm | Back to Note 4
[5] The Foreign and International Monetary Authorities (FIMA) Repo facility: https://www.federalreserve.gov/monetarypolicy/fima-repo-facility.htm | Back to Note 5
[6] https://www.lseg.com/en/insights/ftse-russell/sanae-takaichi-can-the-rock-star-of-japanese-politics-drum-to-the-beat-of-the-markets | Back to Note 6
[7] Potential tourists to Japan may wish to note that on The Economist Big Mac index, as of July 30, 2026, the Japanese Yen is 50.4% undervalued vs. the US Dollar; -47.2% on a GDP per-capita basis | Back to Note 7
[8] https://www.lseg.com/en/insights/ftse-russell/much-ado-about-hedging | Back to Note 8

Read more about

Disclaimer
© [2026] London Stock Exchange Group plc and its applicable group undertakings (“LSEG”). LSEG includes (1) FTSE International Limited (“FTSE”), (2) Frank Russell Company (“Russell”), (3) FTSE Global Debt Capital Markets Inc. “FTSE Canada”, (4) FTSE Fixed Income LLC (“FTSE FI”), (5) FTSE (Beijing) Consulting Limited (“WOFE”), (6) FTSE EU SAS ("FES"). All rights reserved.
FTSE Russell® is a trading name of FTSE, Russell, FTSE Canada, FTSE FI, WOFE, FTSE EU and other LSEG entities providing LSEG Benchmark and Index services. “FTSE®”, “Russell®”, “FTSE Russell®”, “FTSE4Good®”, “ICB®”, “Refinitiv”, “WMR™” “FR™” and all other trademarks and service marks used herein (whether registered or unregistered) are trademarks and/or service marks owned or licensed by the applicable member of LSEG or their respective licensors.
FTSE International Limited is authorised as a Benchmark Administrator and regulated in the United Kingdom (UK) by the Financial Conduct Authority ("FCA") according to the UK Benchmark Regulation, FCA Reference Number 796803. FTSE EU SAS is authorised as Benchmark Administrator and regulated in the European Union (EU) by the Autorité des Marches Financiers (“AMF”) according to the EU Benchmark Regulation.
All information is provided for information purposes only. All information and data contained in this publication is obtained by LSEG, from sources believed by it to be accurate and reliable. Because of the possibility of human and mechanical inaccuracy as well as other factors, however, such information and data is provided "as is" without warranty of any kind. No member of LSEG nor their respective directors, officers, employees, partners or licensors make any claim, prediction, warranty or representation whatsoever, expressly or impliedly, either as to the accuracy, timeliness, completeness, merchantability of any information or LSEG Products, or of results to be obtained from the use of LSEG products, including but not limited to indices, rates, data and analytics, or the fitness or suitability of the LSEG products for any particular purpose to which they might be put. The user of the information assumes the entire risk of any use it may make or permit to be made of the information.
No responsibility or liability can be accepted by any member of LSEG nor their respective directors, officers, employees, partners or licensors for (a) any loss or damage in whole or in part caused by, resulting from, or relating to any inaccuracy (negligent or otherwise) or other circumstance involved in procuring, collecting, compiling, interpreting, analysing, editing, transcribing, transmitting, communicating or delivering any such information or data or from use of this document or links to this document or (b) any direct, indirect, special, consequential or incidental damages whatsoever, even if any member of LSEG is advised in advance of the possibility of such damages, resulting from the use of, or inability to use, such information.
No member of LSEG nor their respective directors, officers, employees, partners or licensors provide investment advice and nothing in this document should be taken as constituting financial or investment advice. No member of LSEG nor their respective directors, officers, employees, partners or licensors make any representation regarding the advisability of investing in any asset or whether such investment creates any legal or compliance risks for the investor. A decision to invest in any such asset should not be made in reliance on any information herein. Indices and rates cannot be invested in directly. Inclusion of an asset in an index or rate is not a recommendation to buy, sell or hold that asset nor confirmation that any particular investor may lawfully buy, sell or hold the asset or an index or rate containing the asset. The general information contained in this publication should not be acted upon without obtaining specific legal, tax, and investment advice from a licensed professional.
Past performance is no guarantee of future results. Charts and graphs are provided for illustrative purposes only. Index and/or rate returns shown may not represent the results of the actual trading of investable assets. Certain returns shown may reflect back-tested performance. All performance presented prior to the index or rate inception date is back-tested performance. Back-tested performance is not actual performance, but is hypothetical. The back-test calculations are based on the same methodology that was in effect when the index or rate was officially launched. However, back-tested data may reflect the application of the index or rate methodology with the benefit of hindsight, and the historic calculations of an index or rate may change from month to month based on revisions to the underlying economic data used in the calculation of the index or rate.
This document may contain forward-looking assessments. These are based upon a number of assumptions concerning future conditions that ultimately may prove to be inaccurate. Such forward-looking assessments are subject to risks and uncertainties and may be affected by various factors that may cause actual results to differ materially. No member of LSEG nor their licensors assume any duty to and do not undertake to update forward-looking assessments.
No part of this information may be reproduced, stored in a retrieval system or transmitted in any form or by any means, electronic, mechanical, photocopying, recording or otherwise, without prior written permission of the applicable member of LSEG. Use and distribution of LSEG data requires a licence from LSEG and/or its licensors.