

Sergiy Lesyk

Matt Monach, CFA

Tom Chan, CFA
| Our key message: In a factor-, industry- and country-neutral Value implementation, excess return rose almost linearly as target exposure increased, while the information ratio showed no material decay. The weak period for Value performance that bottomed in 2020 was not simply a sector or country allocation event; it was a within-peer valuation cycle. Importantly, the post-COVID Technology and AI-led rally did not lead to renewed sustained underperformance in clean Value. |
|---|
Value investing is often debated as a sector story: cheap (high-value) financials, energy and cyclicals versus expensive (low-value) technology and growth. That framing is incomplete. In this analysis, we test the Value factor after removing industry, country and non-Value factor exposures. The result is a cleaner within-peer Value signal.
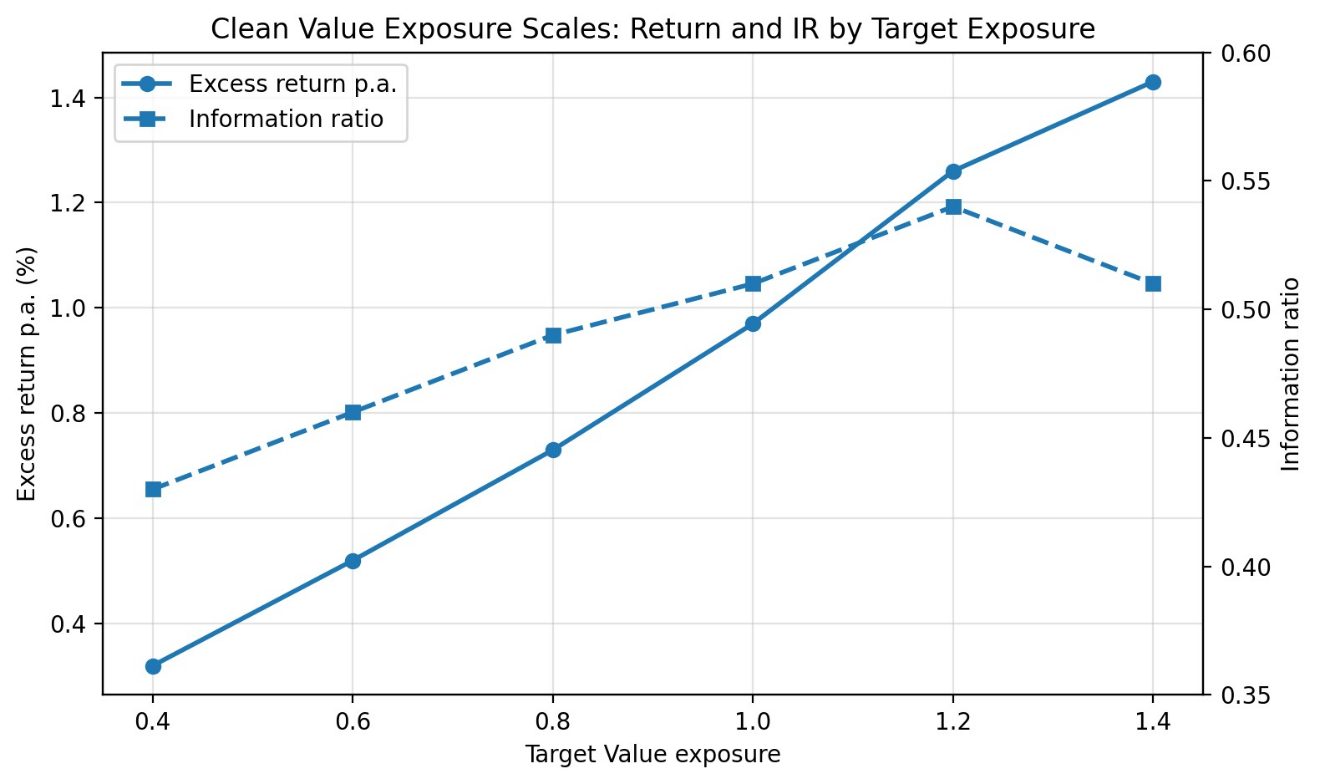
Two findings stand out. First, clean Value scales. Increasing target Value exposure from 0.4 to 1.4 raises annualised excess return from 0.32% to 1.43%, with no material information-ratio decay. Second, clean Value remains cyclical. The drawdown that bottomed around 2020 began earlier, around 2016–2017, and occurred even after we imposed sector, country and factor neutrality. This suggests that investors were not merely buying technology or the US; they were increasingly favouring expensive growth stocks within industries and countries.
For investors, the question is therefore not simply whether Value works. It is how much clean Value exposure is required, and whether investors can tolerate the valuation cycle needed to harvest it.
| Methodology note: We tested Value portfolios based on the FTSE Developed index over the 20 years ending 30 December 2025. Each portfolio targeted a different Value exposure, ranging from 0.4 to 1.4, neutralised active exposure to other factors, and held neutral industry and country active weights with respect to the benchmark. |
|---|
The result: Clean Value scales
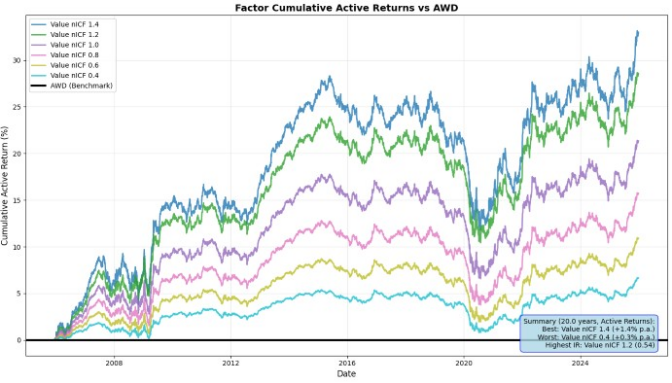
The cumulative active return paths are ordered almost exactly by target exposure (see Exhibit 1). That is what we would expect from a scalable signal rather than a noisy back-test artefact. Higher target exposure delivered higher cumulative active return through the full period, but all variants experienced the same valuation-cycle drawdown around 2020.
Exhibit 1. Scaled clean Value portfolios: cumulative active return vs FTSE Developed
Source: FTSE Russell factor-index simulations. FTSE Developed universe, 20 years ending 30 December 2025. Returns shown may reflect hypothetical historical performance.
A scaling exercise should not be judged only by whether higher exposure produces higher returns. That result is encouraging, but the more important test is whether risk-adjusted efficiency decays as the signal is scaled. In this analysis, it does not: higher target exposure to the Value factor increased active risk, but return rose broadly in line with that risk (see Exhibit 2 and Table 1).
Exhibit 2. Clean Value scaled with no material information-ratio decay
Source: FTSE Russell factor-index simulations. FTSE Developed universe, 20 years ending 30 December 2025. Past performance is not a guide to future returns. Please see the end for important legal disclosures.
Table 1. Performance of factor-, industry- and country-neutral Value implementations
Target Value |
Excess return |
Tracking error |
Information |
Alpha |
One-way |
Avg. |
|---|---|---|---|---|---|---|
0.4 |
0.32 |
0.75 |
0.43 |
1.71 |
26.4 |
1,590 |
0.6 |
0.52 |
1.12 |
0.46 |
1.90 |
37.9 |
1,483 |
0.8 |
0.73 |
1.49 |
0.49 |
2.03 |
49.8 |
1,352 |
1.0 |
0.97 |
1.89 |
0.51 |
2.16 |
62.3 |
1,195 |
1.2 |
1.26 |
2.32 |
0.54 |
2.33 |
75.8 |
1,003 |
1.4 |
1.43 |
2.82 |
0.51 |
2.16 |
91.7 |
776 |
Note: The 1.2 target exposure row is highlighted because it marked the end of a monotonic increase in the information ratio and the alpha t-statistic among the tested variants.
Scaling is not free
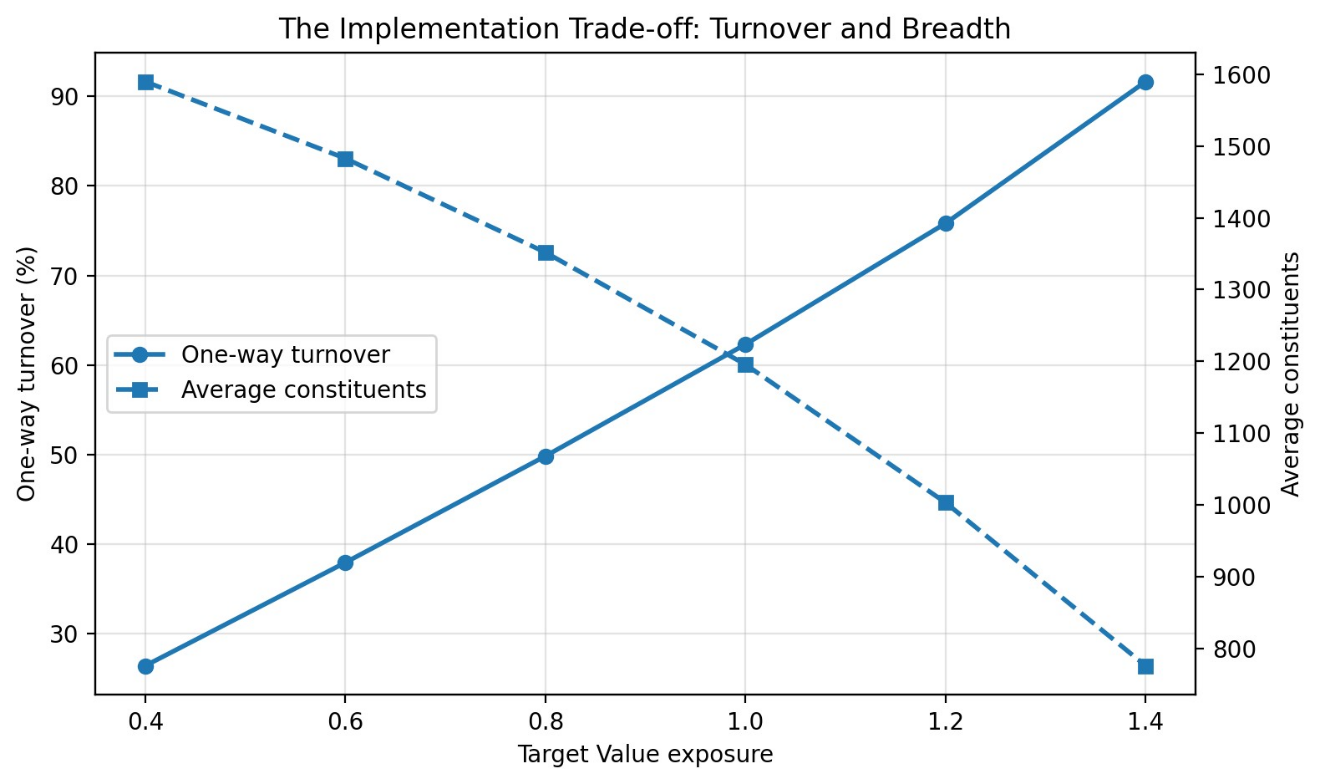
Exhibit 3. Higher exposure requires more turnover and narrower breadth
Source: FTSE Russell factor-index simulations. FTSE Developed universe, 20 years ending 30 December 2025. One-way turnover is shown as half of reported two-way turnover. Past performance is not a guide to future returns. Please see the end for important legal disclosures.
Clean Value remained cyclical
Over the past 20 years, the return from the clean Value factor was broadly persistent, with one prolonged period of underperformance. It remained cyclical, but the cycle was more subtle than the simple sector rotation one might suspect. The rolling three-year information ratio began to fall around 2016–2017 and bottomed in 2020, before recovering. Since these portfolios were industry-, country- and factor-neutral, the drawdown was not simply a Technology-over-Financials trade or a US-over-rest-of-world trade. It reflected cheaper stocks underperforming more expensive peers within comparable opportunity sets.
The post-COVID period is equally important. Even as technology and AI-related stocks led headline market returns, clean Value did not fall back into sustained underperformance. That suggests the 2020 episode was an extreme within-peer growth preference, not proof that a technology-led market is automatically hostile to Value.
Exhibit 4. Clean Value still had a valuation-cycle drawdown
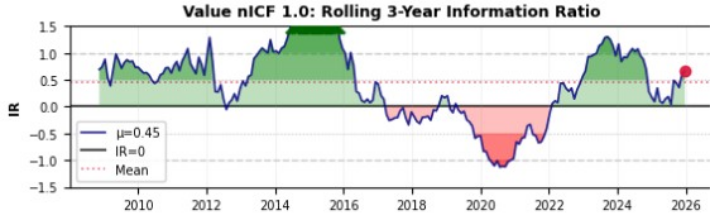
Source: FTSE Russell factor-index simulations. Rolling three-year information ratio for the 1.0 target exposure implementation. Other target exposures showed almost identical amplitudes. Past performance is not a guide to future returns. Please see the end for important legal disclosures.
Conclusion
In our tests, conducted over a two-decade period, the clean Value factor scaled better than many investors might expect. Across the tested range, higher target exposure produced higher excess return with no material deterioration in information ratio. The result suggests that the FTSE Russell Value signal is not merely detectable, but can be sized into an economically meaningful return stream.
The hard part is that purity of the factor signal alone was not enough: clean Value still had a cycle, but it was internal. The signal began weakening before COVID, bottomed in 2020 and recovered thereafter. Because the simulations were industry-, country- and factor-neutral, this was not just technology beating financials or the US beating the rest of the world. It was cheaper stocks losing out to more expensive peers within comparable opportunity sets.
The post-COVID period makes the point more interesting. Even as technology and AI-related stocks led headline market returns, clean Value did not resume sustained underperformance. That suggests the 2020 drawdown was an extreme within-peer valuation event, not a permanent rule that the Value premium cannot coexist with tech leadership.
The implication is that investors should pay particular attention to the practicalities of implementation. They need not only to decide whether they want clean Value exposure, but also how much exposure is appropriate and whether they can tolerate the cycle dynamics required to harvest it.


Disclaimer
© [2026] London Stock Exchange Group plc and its applicable group undertakings (“LSEG”). LSEG includes (1) FTSE International Limited (“FTSE”), (2) Frank Russell Company (“Russell”), (3) FTSE Global Debt Capital Markets Inc. “FTSE Canada”, (4) FTSE Fixed Income LLC (“FTSE FI”), (5) FTSE (Beijing) Consulting Limited (“WOFE”), (6) FTSE EU SAS ("FES"). All rights reserved.
FTSE Russell® is a trading name of FTSE, Russell, FTSE Canada, FTSE FI, WOFE, FTSE EU and other LSEG entities providing LSEG Benchmark and Index services. “FTSE®”, “Russell®”, “FTSE Russell®”, “FTSE4Good®”, “ICB®”, “Refinitiv”, “WMR™” “FR™” and all other trademarks and service marks used herein (whether registered or unregistered) are trademarks and/or service marks owned or licensed by the applicable member of LSEG or their respective licensors.
FTSE International Limited is authorised as a Benchmark Administrator and regulated in the United Kingdom (UK) by the Financial Conduct Authority ("FCA") according to the UK Benchmark Regulation, FCA Reference Number 796803. FTSE EU SAS is authorised as Benchmark Administrator and regulated in the European Union (EU) by the Autorité des Marches Financiers (“AMF”) according to the EU Benchmark Regulation.
All information is provided for information purposes only. All information and data contained in this publication is obtained by LSEG, from sources believed by it to be accurate and reliable. Because of the possibility of human and mechanical inaccuracy as well as other factors, however, such information and data is provided "as is" without warranty of any kind. No member of LSEG nor their respective directors, officers, employees, partners or licensors make any claim, prediction, warranty or representation whatsoever, expressly or impliedly, either as to the accuracy, timeliness, completeness, merchantability of any information or LSEG Products, or of results to be obtained from the use of LSEG products, including but not limited to indices, rates, data and analytics, or the fitness or suitability of the LSEG products for any particular purpose to which they might be put. The user of the information assumes the entire risk of any use it may make or permit to be made of the information.
No responsibility or liability can be accepted by any member of LSEG nor their respective directors, officers, employees, partners or licensors for (a) any loss or damage in whole or in part caused by, resulting from, or relating to any inaccuracy (negligent or otherwise) or other circumstance involved in procuring, collecting, compiling, interpreting, analysing, editing, transcribing, transmitting, communicating or delivering any such information or data or from use of this document or links to this document or (b) any direct, indirect, special, consequential or incidental damages whatsoever, even if any member of LSEG is advised in advance of the possibility of such damages, resulting from the use of, or inability to use, such information.
No member of LSEG nor their respective directors, officers, employees, partners or licensors provide investment advice and nothing in this document should be taken as constituting financial or investment advice. No member of LSEG nor their respective directors, officers, employees, partners or licensors make any representation regarding the advisability of investing in any asset or whether such investment creates any legal or compliance risks for the investor. A decision to invest in any such asset should not be made in reliance on any information herein. Indices and rates cannot be invested in directly. Inclusion of an asset in an index or rate is not a recommendation to buy, sell or hold that asset nor confirmation that any particular investor may lawfully buy, sell or hold the asset or an index or rate containing the asset. The general information contained in this publication should not be acted upon without obtaining specific legal, tax, and investment advice from a licensed professional.
Past performance is no guarantee of future results. Charts and graphs are provided for illustrative purposes only. Index and/or rate returns shown may not represent the results of the actual trading of investable assets. Certain returns shown may reflect back-tested performance. All performance presented prior to the index or rate inception date is back-tested performance. Back-tested performance is not actual performance, but is hypothetical. The back-test calculations are based on the same methodology that was in effect when the index or rate was officially launched. However, back-tested data may reflect the application of the index or rate methodology with the benefit of hindsight, and the historic calculations of an index or rate may change from month to month based on revisions to the underlying economic data used in the calculation of the index or rate.
This document may contain forward-looking assessments. These are based upon a number of assumptions concerning future conditions that ultimately may prove to be inaccurate. Such forward-looking assessments are subject to risks and uncertainties and may be affected by various factors that may cause actual results to differ materially. No member of LSEG nor their licensors assume any duty to and do not undertake to update forward-looking assessments.
No part of this information may be reproduced, stored in a retrieval system or transmitted in any form or by any means, electronic, mechanical, photocopying, recording or otherwise, without prior written permission of the applicable member of LSEG. Use and distribution of LSEG data requires a licence from LSEG and/or its licensors.