

David Harris

Arne Staal
As capital floods into sustainable finance products and strategies, companies are finding themselves assessed by investors against a whole range of novel performance indicators. We have talked before in this series on sustainable Investment data trends about how this is driving a shift towards a common language on sustainable investment, and, also challenging market participants and data providers on materiality. Environmental, social and governance (ESG) metrics can dictate under- or overweighting in indexes or portfolios, or even the inclusion or exclusion from an investable universe. The incorporation of sustainable Investment factors into investment strategies is shifting capital away from poor sustainability performers towards their better performing peers.
However, there is often a lack of understanding among many companies as to how their sustainability practices and performance, whether disclosed or estimated by an analyst, flow through to the investment strategy or index. Most companies have very little idea how the sustainability data they publish is harvested, aggregated and deployed by investors to influence capital allocation and hence investment flows.
For large, listed companies, the most visible interaction with the financial sector is via sell-side analysts. For these companies, such analysts can become the prism through which they understand all investor assessments of their corporate performance. Their analysis may use some "black box" methodologies, but they will typically explain to their audience of institutional investors how they have come to a view on each company’s sustainability performance, and how it impacts their evaluation of a company’s prospects.
However, companies are often unclear about how assessments of their sustainability performance are made which can impact the extent to which they are represented in quant funds and passive portfolios. Such pools of capital represent a large and growing proportion of global investment portfolios.
To help address this, we thought it might be useful to show how sustainability factors influence the weighting of four illustrative companies in a popular FTSE Russell climate-tilted index, the FTSE TPI Climate Transition Index. Climate-adjusted index funds represent one of the most rapidly growing areas of investment management as investors switch to these from more conventional benchmarks. Although we discuss here the specific approach taken by this index, it is similar to those taken by a growing number of investment strategies that seek to track a benchmark while increasing exposure to better sustainability performers while reducing exposure to laggards.
The index is created in partnership with the Transition Pathway Initiative (TPI), which is a global, asset-owner led initiative that assesses companies' preparedness for the transition to a low-carbon economy. The index applies a variety of climate parameters to modify the weights of companies in the index based on their climate credentials.
The specific FTSE TPI index explained here takes the constituents of the FTSE Developed Index and assesses each company against five metrics. The first three are their fossil fuel reserves, their carbon emissions (both of which are normalized against revenues), and the percentage of their revenues generated by green products or services.
The last two are assessments – undertaken in partnership with the TPI- – of the company’s climate management quality, which is based upon factors such as climate reporting and governance, including emissions reduction target-setting and climate-linked remuneration; and of its carbon performance, that is, whether its targets are in line with international emissions goals.
These metrics are used to alter the weighting of each company in the benchmark index. The diagram below sets this out for four companies to clarify how this works in practice.
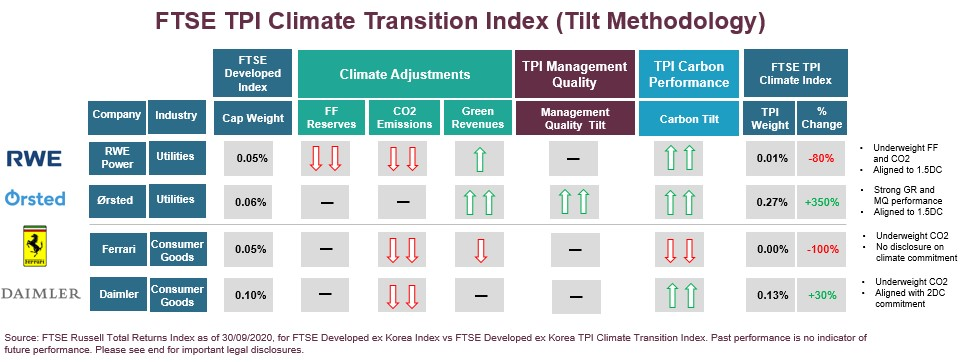
Take two companies in the Utilities sector. Germany’s RWE, with its large coal-fired power fleet, scores poorly on fossil fuel reserves and CO2 emissions. Its relatively small wind and solar fleet gives it a limited uplift from green revenues. A moderately good management quality score is outweighed by targets that are not aligned with what is needed to meet the Paris Agreement goals.
The upshot? RWE’s weighting of 0.05% in the FTSE Developed Index is reduced to 0.01% in the FTSE TPI Climate Index, an 80% reduction.
Denmark’s Ørsted, meanwhile, has successfully transitioned over the past two decades, from an energy company based on coal and oil (formally known as Dong Energy) to a global leader in renewables. Its high proportion of green revenues and strong TPI scores means its weighting is increased by 350%, from 0.06% in the benchmark to 0.27% in the climate index.
Ferrari and Daimler provide an analogous example in the auto sector. The Italian luxury car maker scores poorly on CO2 emissions (from its operations) and has limited green revenues compared with its peers. It also scores poorly on both TPI scores. As with RWE, the scores lead to a zero weighting in the climate index.
Daimler does significantly better. A poor score on CO2 emissions and low green revenues are offset by positive TPI assessments of carbon performance linked to its future targets set for vehicle emissions. The result is an increase in its weighting by 30% in the benchmark to the FTSE TPI Climate Transition Index.
These examples show how sustainability metrics can be applied through a transparent, rules-based methodology to deliver a quantitatively driven outcome. As the volumes of investment managed with a sustainability or climate lens grow, how corporate data is created, analysed and deployed will have a growing influence on capital flows. It is important, therefore, that companies understand these processes as they may significantly influence their cost of capital. Hold onto your seats, engagement between companies and investors is set to intensify.
This is the third in our series of posts looking at trends in SI data.


Disclaimer
© 2025 London Stock Exchange Group plc and its applicable group undertakings (“LSEG”). LSEG includes (1) FTSE International Limited (“FTSE”), (2) Frank Russell Company (“Russell”), (3) FTSE Global Debt Capital Markets Inc. and FTSE Global Debt Capital Markets Limited (together, “FTSE Canada”), (4) FTSE Fixed Income Europe Limited (“FTSE FI Europe”), (5) FTSE Fixed Income LLC (“FTSE FI”), (6) FTSE (Beijing) Consulting Limited (“WOFE”) (7) Refinitiv Benchmark Services (UK) Limited (“RBSL”), (8) Refinitiv Limited (“RL”) and (9) Beyond Ratings S.A.S. (“BR”). All rights reserved.
FTSE Russell® is a trading name of FTSE, Russell, FTSE Canada, FTSE FI, FTSE FI Europe, WOFE, RBSL, RL, and BR. “FTSE®”, “Russell®”, “FTSE Russell®”, “FTSE4Good®”, “ICB®”, “Refinitiv” , “Beyond Ratings®”, “WMR™” , “FR™” and all other trademarks and service marks used herein (whether registered or unregistered) are trademarks and/or service marks owned or licensed by the applicable member of LSEG or their respective licensors and are owned, or used under licence, by FTSE, Russell, FTSE Canada, FTSE FI, FTSE FI Europe, WOFE, RBSL, RL or BR. FTSE International Limited is authorised and regulated by the Financial Conduct Authority as a benchmark administrator. Refinitiv Benchmark Services (UK) Limited is authorised and regulated by the Financial Conduct Authority as a benchmark administrator.
All information is provided for information purposes only. All information and data contained in this publication is obtained by LSEG, from sources believed by it to be accurate and reliable. Because of the possibility of human and mechanical inaccuracy as well as other factors, however, such information and data is provided "as is" without warranty of any kind. No member of LSEG nor their respective directors, officers, employees, partners or licensors make any claim, prediction, warranty or representation whatsoever, expressly or impliedly, either as to the accuracy, timeliness, completeness, merchantability of any information or LSEG Products, or of results to be obtained from the use of LSEG products, including but not limited to indices, rates, data and analytics, or the fitness or suitability of the LSEG products for any particular purpose to which they might be put. The user of the information assumes the entire risk of any use it may make or permit to be made of the information.
No responsibility or liability can be accepted by any member of LSEG nor their respective directors, officers, employees, partners or licensors for (a) any loss or damage in whole or in part caused by, resulting from, or relating to any inaccuracy (negligent or otherwise) or other circumstance involved in procuring, collecting, compiling, interpreting, analysing, editing, transcribing, transmitting, communicating or delivering any such information or data or from use of this document or links to this document or (b) any direct, indirect, special, consequential or incidental damages whatsoever, even if any member of LSEG is advised in advance of the possibility of such damages, resulting from the use of, or inability to use, such information.
No member of LSEG nor their respective directors, officers, employees, partners or licensors provide investment advice and nothing in this document should be taken as constituting financial or investment advice. No member of LSEG nor their respective directors, officers, employees, partners or licensors make any representation regarding the advisability of investing in any asset or whether such investment creates any legal or compliance risks for the investor. A decision to invest in any such asset should not be made in reliance on any information herein. Indices and rates cannot be invested in directly. Inclusion of an asset in an index or rate is not a recommendation to buy, sell or hold that asset nor confirmation that any particular investor may lawfully buy, sell or hold the asset or an index or rate containing the asset. The general information contained in this publication should not be acted upon without obtaining specific legal, tax, and investment advice from a licensed professional.
Past performance is no guarantee of future results. Charts and graphs are provided for illustrative purposes only. Index and/or rate returns shown may not represent the results of the actual trading of investable assets. Certain returns shown may reflect back-tested performance. All performance presented prior to the index or rate inception date is back-tested performance. Back-tested performance is not actual performance, but is hypothetical. The back-test calculations are based on the same methodology that was in effect when the index or rate was officially launched. However, back-tested data may reflect the application of the index or rate methodology with the benefit of hindsight, and the historic calculations of an index or rate may change from month to month based on revisions to the underlying economic data used in the calculation of the index or rate.
This document may contain forward-looking assessments. These are based upon a number of assumptions concerning future conditions that ultimately may prove to be inaccurate. Such forward-looking assessments are subject to risks and uncertainties and may be affected by various factors that may cause actual results to differ materially. No member of LSEG nor their licensors assume any duty to and do not undertake to update forward-looking assessments.
No part of this information may be reproduced, stored in a retrieval system or transmitted in any form or by any means, electronic, mechanical, photocopying, recording or otherwise, without prior written permission of the applicable member of LSEG. Use and distribution of LSEG data requires a licence from LSEG and/or its licensors.