
Futures markets tell us what happened, but understanding who drove those moves and why is often less clear. Prices, volumes and positioning reports provide valuable signals, yet much of the activity shaping market outcomes remains obscured until long after decisions have been made.
Against this backdrop, new research into futures market flows offers a different perspective. Rather than focusing solely on price action, it examines the behaviour of the participants driving those moves and the interaction between speculative and hedging activity.
This insight explores:
- How different trader groups contribute to futures price formation
- Why market impact is not evenly distributed across markets
- What near real-time flow forecasts reveal about liquidity, market resilience and positioning
- How flow-based intelligence can support risk management, execution and investment research
Every day, thousands of futures market participants express views on prices, manage risk and hedge physical exposures. The challenge is understanding how these competing motivations combine to shape market outcomes.
Traditional analysis often relies on public Commitments of Traders (COT) reports, price behaviour and volume patterns. While valuable, these approaches provide only a partial view and often arrive after the most important decisions have been made.
The result is a familiar challenge – understanding what has happened, but with limited visibility into why it happened.
From positions to price formation
A recent study using Trading Flow, powered by LSEG data and Exponential Technology’s advanced analytics, examined two of the most influential participant groups in futures markets:
- Managed money: Systematic and discretionary speculative investors, including commodity trading advisors (CTAs)
- Producer/Merchant participants: Commercial firms that hedge exposure linked to underlying physical commodities
Modelling both groups together reveals not only how each behaves individually, but also how liquidity demand and liquidity supply interact across markets.
The findings reveal a consistent pattern. Managed money activity tends to move in the same direction as market returns, while producer activity generally moves against them. In many markets, the two groups take opposite sides of the same trade, creating a mirror-image relationship between speculative and hedging flows. In effect, speculative traders often amplify price moves, while commercial hedgers provide liquidity and act as a stabilising force.
Unlike volume and open interest data, flow-based analysis captures the direction of market participation, helping distinguish between liquidity-demanding speculative activity and liquidity-supplying hedging activity. This provides additional context on who is driving market moves and how different participant groups contribute to price formation.
Measuring market impact through flow
One of the study's most significant findings is its ability to quantify market impact through flow. Across more than a decade of futures market data:
- Managed money flow showed a positive relationship with same-day returns (+0.37 correlation)
- Producer flow displayed the opposite relationship (-0.17 correlation)
- Public measures such as volume and open interest changes contained little comparable directional information
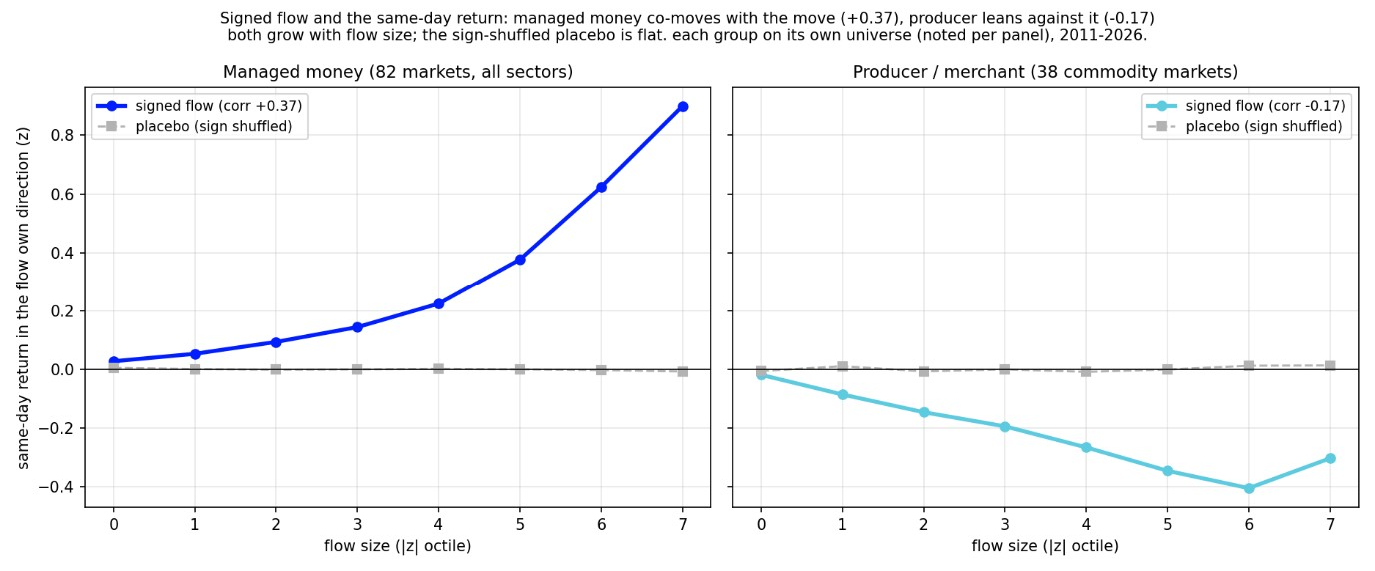
| Flow Size Octile | Managed Money Return (z) | Managed Money Placebo (z) | Producer/Merchant Return (z) | Producer/Merchant Placebo (z) |
|---|---|---|---|---|
| 0 | 0.03 | 0.00 | -0.02 | 0.00 |
| 1 | 0.05 | 0.00 | -0.08 | 0.01 |
| 2 | 0.09 | 0.00 | -0.15 | 0.00 |
| 3 | 0.14 | 0.00 | -0.20 | 0.00 |
| 4 | 0.22 | 0.00 | -0.27 | -0.01 |
| 5 | 0.38 | 0.00 | -0.35 | 0.00 |
| 6 | 0.62 | 0.00 | -0.41 | 0.01 |
| 7 | 0.89 | -0.01 | -0.30 | 0.01 |
This distinction matters because it provides a framework for understanding who is moving the market and whether that activity is likely to reinforce or counteract prevailing trends.
The research further demonstrates that market impact is not evenly distributed. Energy, metals and certain commodity markets exhibit higher sensitivity to speculative flows than deeper, more liquid markets such as rates and treasury futures.
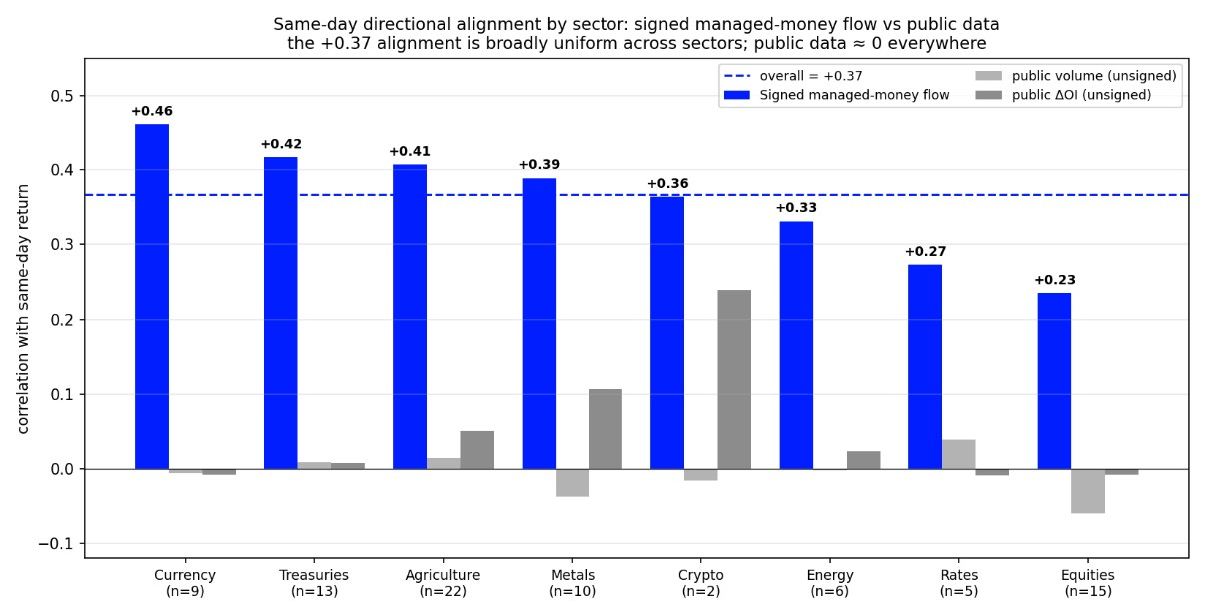
| Sector | Markets (n) | Signed Managed Money Flow Correlation | Public Volume (Unsigned) | Public OI (Unsigned) |
|---|---|---|---|---|
| Currency | 9 | 0.46 | -0.01 | -0.01 |
| Treasuries | 13 | 0.42 | 0.00 | 0.01 |
| Agriculture | 22 | 0.41 | 0.01 | 0.05 |
| Metals | 10 | 0.39 | -0.04 | 0.11 |
| Crypto | 2 | 0.36 | 0.24 | -0.02 |
| Energy | 6 | 0.33 | 0.00 | 0.03 |
| Rates | 5 | 0.27 | 0.04 | -0.01 |
| Equities | 15 | 0.23 | -0.06 | -0.01 |
Why liquidity matters
Price movements are influenced not only by who trades, but also by how much liquidity is available to absorb those trades. The study introduces a flow-based view of market elasticity, showing that markets with less nearby liquidity tend to experience larger price moves from equivalent trading activity.
Importantly, this relationship remains evident even after controlling for traditional volatility measures. Markets that appear relatively calm can still display outsized sensitivity to flow, creating what the analysis describes as ‘hidden inelasticity’. In other words, some markets may be more fragile than traditional volatility measures alone suggest.
In practical terms, this provides a new lens for assessing market fragility:
- Identify markets that may move disproportionately on flow
- Improve position sizing decisions
- Enhance risk management frameworks
- Better understand how liquidity conditions vary across asset classes
Two flows, two market behaviours
One of the most revealing findings comes from analysing the reaction curves of both trader groups.
The study shows that producer participants consistently display a classic liquidity-providing profile – buying into weakness and selling into strength.
Managed money participants exhibit the opposite behaviour, increasing exposure in the direction of prevailing price trends.
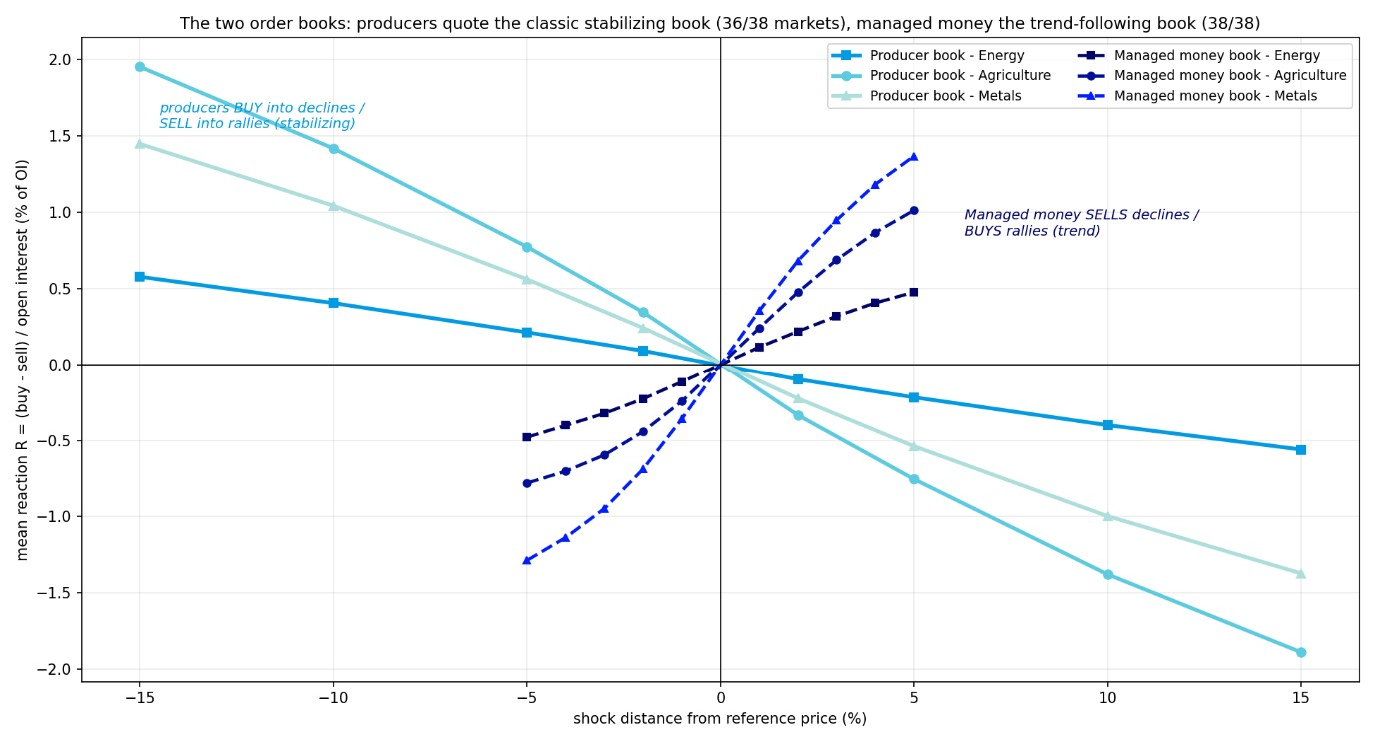
| Shock Distance (%) | Energy | Agriculture | Metals |
|---|---|---|---|
| -15 | 0.58 | 1.95 | 1.43 |
| -10 | 0.40 | 1.42 | 1.03 |
| -5 | 0.20 | 0.77 | 0.55 |
| 0 | 0.00 | 0.00 | 0.00 |
| 2 | -0.10 | -0.34 | -0.22 |
| 5 | -0.22 | -0.76 | -0.55 |
| 10 | -0.40 | -1.39 | -1.00 |
| 15 | -0.56 | -1.90 | -1.38 |
This creates two fundamentally different forms of market behaviour:
- A stabilising liquidity-providing profile associated with commercial hedgers
- A trend-following profile associated with speculative participants
Understanding how these two forces interact can provide additional context on whether a market move is being reinforced by speculative activity or counterbalanced by commercial hedging.
Validated against real-world positioning
Any forecasting model ultimately needs to be assessed against observed outcomes. To test the effectiveness of the flow models, researchers compared the results with actual CFTC Commitments of Traders data. The findings showed:
- Approximately 71% directional agreement with managed money positioning changes
- Approximately 74% directional agreement with producer/merchant positioning changes
- Strong alignment between modelled market impact measures and their corresponding CFTC categories
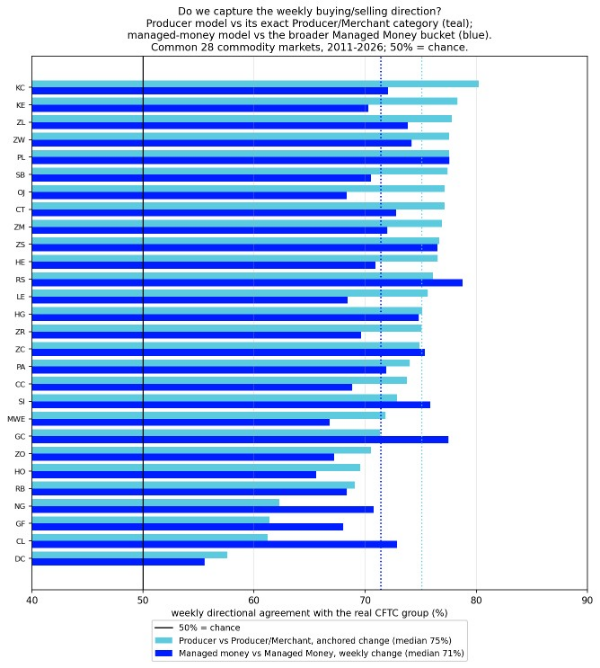
| Market | Producer vs Producer/Merchant (%) | Managed Money vs Managed Money (%) |
|---|---|---|
| KC | 80.0 | 72.0 |
| KE | 78.3 | 70.5 |
| ZL | 77.8 | 74.0 |
| ZW | 77.0 | 74.5 |
| PL | 77.0 | 77.0 |
| SB | 76.8 | 70.5 |
| OJ | 76.5 | 68.5 |
| CT | 76.5 | 73.0 |
| ZM | 76.2 | 72.0 |
| ZS | 76.0 | 76.0 |
| HE | 76.0 | 71.0 |
| RS | 75.5 | 78.8 |
| LE | 75.0 | 68.5 |
| HG | 75.0 | 74.8 |
| ZR | 75.0 | 69.8 |
| ZC | 74.0 | 75.3 |
| PA | 74.0 | 72.0 |
| CC | 73.8 | 69.0 |
| SI | 73.0 | 75.8 |
| MWE | 71.8 | 67.0 |
| GC | 71.5 | 77.0 |
| ZO | 70.5 | 67.0 |
| HO | 69.5 | 65.5 |
| RB | 69.0 | 68.0 |
| NG | 62.5 | 71.0 |
| GF | 61.5 | 67.5 |
| CL | 61.3 | 73.0 |
| DC | 57.8 | 55.5 |
From theory to tradeable alpha
Daily flow forecasts are delivered with a one-day lag, so they cannot be used to trade the same day’s market moves directly. However, researchers found that the forecasts can support two fully forward-looking long–short strategies, translating these insights into systematic signals.
- Producer release-cycle strategy (Sharpe ratio: 1.24): By taking positions based on forecast producer activity ahead of weekly CFTC releases, the strategy captures subsequent market reactions. Using a simple, consistent rule throughout the study period, it achieved strong risk-adjusted performance, with lower volatility and drawdown than a traditional buy-and-hold approach.
- Managed money conviction strategy (Sharpe ratio: 0.82): This market-neutral strategy measures the strength of speculative positioning conviction, distinguishing crowded markets from more balanced ones. The results demonstrate attractive diversification characteristics and a low correlation with broader futures markets.
Together, these findings suggest that flow forecasts can do more than explain market behaviour after the fact. They can also provide a foundation for developing forward-looking quantitative signals based on participant behaviour and positioning dynamics.
Beyond transparency: Practical applications
The implications extend beyond understanding market structure. The research identifies several practical applications for futures market participants:
- Risk management: Monitor concentration, market fragility and liquidity conditions before they become visible through price action alone.
- Position sizing: Identify markets that exhibit hidden inelasticity and may react disproportionately to new flow.
- Market monitoring: Track the balance between speculative participation and commercial hedging activity.
- Execution strategy: Align trading activity with prevailing liquidity conditions and observed flow behaviour.
- Research and signal development: Incorporate flow-based indicators into systematic models and quantitative research frameworks.

From observation to understanding
Prices and volumes reveal only part of what is happening in futures markets. By modelling speculative and commercial flows together and validating the forecasts against reported positioning data, this research provides a clearer view of who may be driving market moves and how available liquidity can shape their impact.
As markets become increasingly interconnected and liquidity conditions evolve more rapidly, understanding participant behaviour is becoming as important as understanding price itself. Flow-based intelligence offers an additional lens through which market participants can interpret risk, liquidity and opportunity as events unfold.


Legal Disclaimer
Republication or redistribution of LSE Group content is prohibited without our prior written consent.
The content of this publication is for informational purposes only and has no legal effect, does not form part of any contract, does not, and does not seek to constitute advice of any nature and no reliance should be placed upon statements contained herein. Whilst reasonable efforts have been taken to ensure that the contents of this publication are accurate and reliable, LSE Group does not guarantee that this document is free from errors or omissions; therefore, you may not rely upon the content of this document under any circumstances and you should seek your own independent legal, investment, tax and other advice. Neither We nor our affiliates shall be liable for any errors, inaccuracies or delays in the publication or any other content, or for any actions taken by you in reliance thereon.
Copyright © 2026 London Stock Exchange Group. All rights reserved.
The content of this publication is provided by London Stock Exchange Group plc, its applicable group undertakings and/or its affiliates or licensors (the “LSE Group” or “We”) exclusively.
Neither We nor our affiliates guarantee the accuracy of or endorse the views or opinions given by any third party content provider, advertiser, sponsor or other user. We may link to, reference, or promote websites, applications and/or services from third parties. You agree that We are not responsible for, and do not control such non-LSE Group websites, applications or services.
The content of this publication is for informational purposes only. All information and data contained in this publication is obtained by LSE Group from sources believed by it to be accurate and reliable. Because of the possibility of human and mechanical error as well as other factors, however, such information and data are provided "as is" without warranty of any kind. You understand and agree that this publication does not, and does not seek to, constitute advice of any nature. You may not rely upon the content of this document under any circumstances and should seek your own independent legal, tax or investment advice or opinion regarding the suitability, value or profitability of any particular security, portfolio or investment strategy. Neither We nor our affiliates shall be liable for any errors, inaccuracies or delays in the publication or any other content, or for any actions taken by you in reliance thereon. You expressly agree that your use of the publication and its content is at your sole risk.
To the fullest extent permitted by applicable law, LSE Group, expressly disclaims any representation or warranties, express or implied, including, without limitation, any representations or warranties of performance, merchantability, fitness for a particular purpose, accuracy, completeness, reliability and non-infringement. LSE Group, its subsidiaries, its affiliates and their respective shareholders, directors, officers employees, agents, advertisers, content providers and licensors (collectively referred to as the “LSE Group Parties”) disclaim all responsibility for any loss, liability or damage of any kind resulting from or related to access, use or the unavailability of the publication (or any part of it); and none of the LSE Group Parties will be liable (jointly or severally) to you for any direct, indirect, consequential, special, incidental, punitive or exemplary damages, howsoever arising, even if any member of the LSE Group Parties are advised in advance of the possibility of such damages or could have foreseen any such damages arising or resulting from the use of, or inability to use, the information contained in the publication. For the avoidance of doubt, the LSE Group Parties shall have no liability for any losses, claims, demands, actions, proceedings, damages, costs or expenses arising out of, or in any way connected with, the information contained in this document.
LSE Group is the owner of various intellectual property rights ("IPR”), including but not limited to, numerous trademarks that are used to identify, advertise, and promote LSE Group products, services and activities. Nothing contained herein should be construed as granting any licence or right to use any of the trademarks or any other LSE Group IPR for any purpose whatsoever without the written permission or applicable licence terms.