
Summary
This case study outlines how Phoenix Group collaborated with FTSE Russell to design and implement a climate transition equity benchmark that would support Phoenix Group’s decarbonisation targets and form the basis of a sustainable default investment proposition for Phoenix Group clients. We evaluate this approach in the context of IIGCC’s Net Zero Investment Framework, which offers principle-based guidance to help investors align portfolios with net zero goals. By mapping the Phoenix Group/FTSE Climate Aligned approach to NZIF, the case study highlights the practical application of net zero investment principles within the investment strategy.
Profile
Phoenix Group is the UK’s largest long-term savings and retirement business with £280 billion of assets under administration and 12 million customers of trusted pensions, savings and life insurance.
Objectives
Phoenix Group is committed to tackling climate change and taking action to manage the risks and maximise the opportunities for their customers associated with rising global temperatures.
The Phoenix Group was looking to establishing a series of Climate Aligned equity benchmarks to drive decarbonisation over medium (2030) and long-term (2050) horizons to ensure decarbonisation plans are aligned with wider business objectives and deliver the right outcomes for their customers.
At Phoenix Group, we believe that transition risk will be a key driver of returns over the coming decades as governments, corporates and customers respond to managing climate risk. The management of the risks and opportunities presented as the world navigates the transition will be critical to delivering the best financial outcomes for our policyholders.
Graham Cook
Solution
The FTSE Phoenix Climate Aligned Index Series follows core principles set by Phoenix ensuring that climate risk management and engaging for change are at its core. Phoenix’s Group Exclusion Policy is also embedded within the index design, removing companies engaged in specific products and business practices that are not aligned to Phoenix’s sustainability principles or net zero objectives.
The custom equity benchmarks are designed to decarbonise and re-weight a portfolio towards assets with forward-looking climate transition commitments – using TPI data inputs – as well as companies generating revenues from green products and services while reducing portfolio carbon intensity by 7% year on year.
The resulting indices form the basis of a sustainable default investment proposition for Phoenix’s clients.
Phoenix Group’s climate commitment
Phoenix Group is the UK’s largest long-term savings and retirement business. It established its Net Zero Transition Plan in 2023, in recognition of Phoenix Group’s ‘responsibility to tackle climate change...to manage risks and maximise the opportunities of climate change on behalf of [its] 12 million customers... 90% of whom expect Phoenix Group to invest their money responsibly’.
By taking actions to decarbonise, Phoenix Group believes that it can manage the risks and maximise the opportunities of climate change on behalf of its customer base. And with close to £300 billion assets under administration, there is an opportunity to use its scale to make a real difference.
Whilst Phoenix Group’s priority is ensuring the delivery of good customer outcomes, Phoenix Group believes that investing in companies and projects committed to supporting the transition to net zero by 2050, and influencing others to take action, is part of delivering those outcomes. [Note 1]
Phoenix Group’s Net Zero Transition Plan committed the business to achieving net zero across its investment portfolio, operations and supply chain by 2050 or sooner. This included nearer-term commitments in 2025 and 2030 (see right).
Almost all (c.99%) of Phoenix Group’s carbon footprint comes from its investment portfolio, making decarbonising its investments core to delivering on its net zero commitment. In parallel, Phoenix Group has a long-term commitment to invest up to £40bn in sustainable, transition and productive assets. Phoenix Group also recognises that stewardship is an important element of driving change. It aims to be vocal in calling for action from others and convening stakeholders to drive the wider system change that will ultimately be needed to become net zero.
Phoenix Group’s Net Zero Transition Plan
- By 2025. Phoenix Group will reduce the carbon intensity of their listed equity and credit assets by 25% where they can exercise control and influence.
- By 2030. Phoenix Group will cut the carbon intensity of all assets where they can exercise control and influence by at least 50%.
- By 2050. Phoenix Group are committed to achieving across their entire business.
Designing climate transition benchmarks to support portfolio decarbonisation
Overview and outcomes
Phoenix Group began working with FTSE Russell in 2021 to design a series of climate transition benchmarks. The resulting collaboration over the following three years led to the development of two separate equity index series. The FTSE Phoenix Climate Aware Index launched in June 2024 with an equity allocation of £13 billion. The FTSE Phoenix Group Climate Aligned Index Series launched in January 2025 and has enabled Phoenix Group to make significant progress in how it is supporting its customers in the journey to net zero. In particular:
- An allocation of £22 billion will be made to the FTSE All-Share Phoenix Climate Aware Index in 2025
- The Climate Aligned indices are being used as the foundation for workplace pension default passive equity funds
- Funds using the FTSE Phoenix Climate Aligned Indices will obtain the FCA’s SDR “Sustainable Improvers” label. Standard Life’s default workplace pension fund building blocks achieved the label ahead of any regulatory requirements for pension schemes to use the SDR labels. Standard Life is part of the Phoenix Group.
Setting the parameters for a climate transition index
The FTSE Phoenix Climate Aligned Index Series was designed to decarbonise and re-weight a portfolio towards assets with forward-looking climate transition commitments – using company assessments from the Transition Pathway Initiative (TPI) – as well as companies generating revenues from green products and services. The benchmarks also reduce portfolio carbon intensity by 7% year on year.
In addition, TPI assessments inform part of the Phoenix Group exclusion policy and ensures a feedback loop between investment strategy and stewardship activities, which are a key part of Phoenix Group’s Net Zero Transition plan. The inclusion of the TPI assessments in index design can be used to identify climate leaders and to help prioritise engagement. It is also a key feature of the index methodology, helping determine which constituents are achieving the target climate objectives.
A target exposure (tilting) methodology is used to incorporate a range of data points that in aggregate deliver an index that meets Phoenix Group’s climate and net zero objectives, and align to the requirements of the FCAs SDR Sustainable Improvers label. The specific inputs and outcomes are summarised in Table 1, below.
Table 1 – FTSE Phoenix Climate Aligned Index Series – Inputs and outcomes/targets
| Climate / ESG parameter | Outcome / Target |
|---|---|
| TPIs forward-looking company assessments – Management Quality and Carbon Performance | Index constituents are re-weighted in favour of companies that are better prepared for the climate transition. For example, companies assessed by the TPI as aligned to 1.5C or below 2C on a Carbon Performance basis, receive significant (1.5x to 2x) upward tilts. TPI MQ scores are uplifted relative to the benchmark starting point, ensuring the Climate Aligned Index achieves a higher aggregate TPI MQ score vs the benchmark. |
| A decarbonisation trajectory of 7% per year | Progressive index / portfolio decarbonisation that supports a Net Zero by 2050 objective |
| FTSE Green Revenues data | Exposure to green revenues in the Climate Aligned Index is targeted to be above (min. 150% of) the benchmark exposure |
| Custom exclusion policy | Alignment with Standard Life customer needs. Categories include: Controversial Weapons, Controversies, Oil Sands (extraction), Thermal Coal (power generation) and Tobacco. |
| FTSE ESG scores | Applied as a screen, to remove constituents achieving the lowest ESG scores in the benchmark universe.[Note 2] |
Source: FTSE Russell
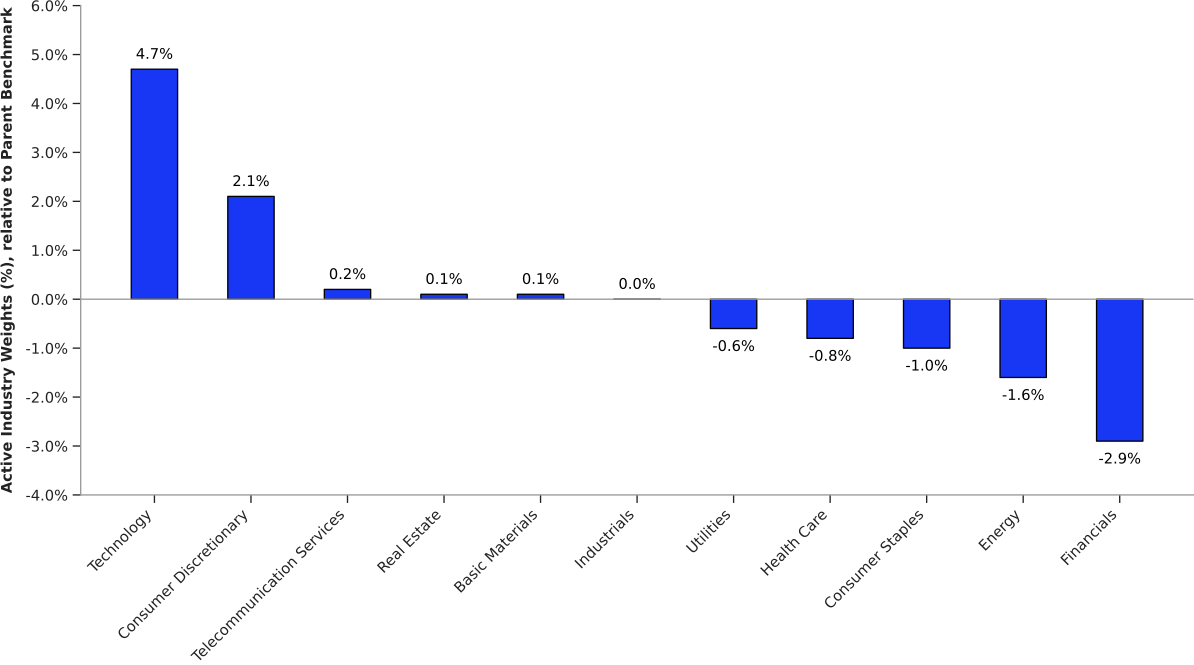
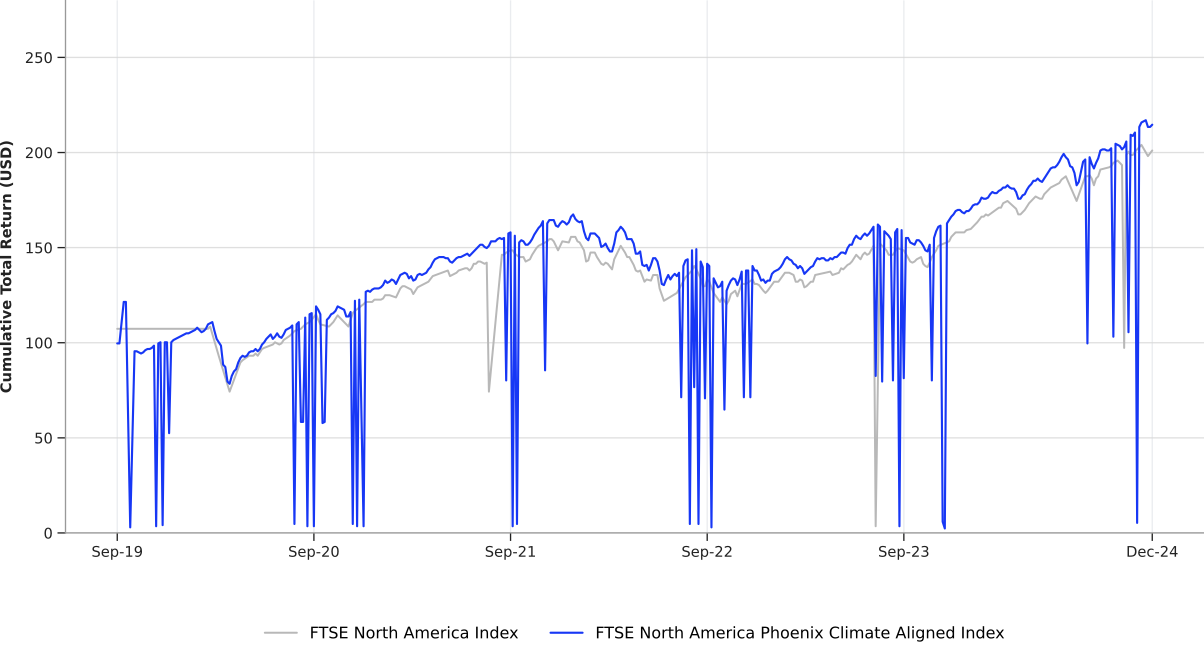
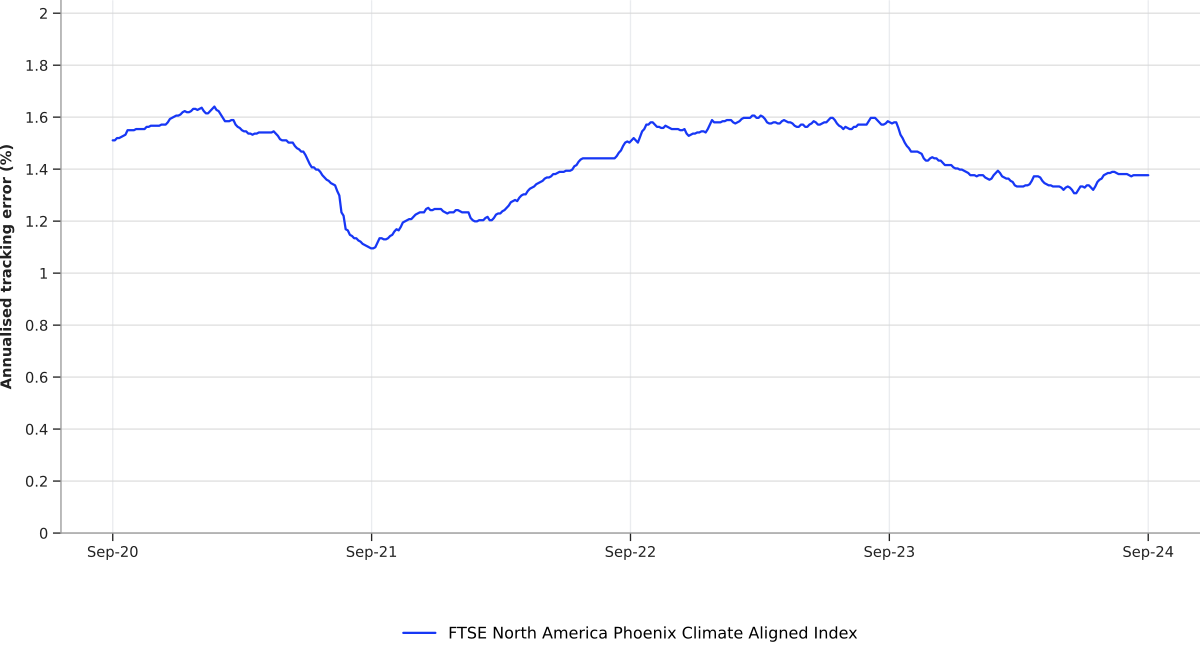
A range of indicative index characteristics for the FTSE North America Phoenix Climate Aligned Index are shown below. Table 2 highlights index outcomes versus the benchmark related to carbon (emissions and reserves) and green revenues exposure. Figures 1 and 2 show the active industry weights and the total return (benchmark vs index), respectively. Figure 3 shows the annualised tracking error over the simulation period.
Table 2 – Selected climate characteristics (FTSE North America Index vs FTSE North America Phoenix Climate Aligned Index)
| Climate stats | FTSE North America Index | FTSE NA Phoenix Climate Aligned Index | Difference (Index vs. Benchmark) |
|---|---|---|---|
| Weighted Average Emission Intensity (Scope 1&2 CO2 metric Tons/USD$m EVIC) | 28.4 | 15.79 | -44% |
| Fossil Fuel Reserve Intensity (CO2 metric Tons/USD$m Equity) | 617.0 | 308.0 | -50% |
| Green Revenue (% of total revenue) | 8.2 | 12.3 | 150% |
Source: FTSE Russell, Data as at January 2025
Figure 1: Active Industry Weights, FTSE North America Phoenix Climate Aligned Index
Source: FTSE Russell, Data as at 30 December 2024
| Industry | Active Industry Weight (% Relative to Parent Benchmark) |
|---|---|
| Technology | +4.7% |
| Consumer Discretionary | +2.1% |
| Telecommunication Services | +0.2% |
| Real Estate | +0.1% |
| Basic Materials | +0.1% |
| Industrials | 0.0% |
| Utilities | -0.6% |
| Health Care | -0.8% |
| Consumer Staples | -1.0% |
| Energy | -1.6% |
| Financials | -2.9% |
Figure 2 – Total Return (USD), Sep 2019 to Dec 2024
Source: FTSE Russell, Data as at 30 December 2024
| Date | FTSE North America Index | FTSE North America Phoenix Climate Aligned Index |
|---|---|---|
| Sep 2019 (Starting value) | 100 | 100 |
| Early 2020 | Declined below 100 before recovering | Declined below 100 before recovering |
| Sep 2020 | Approximately 110 | Approximately 115 |
| Sep 2021 | Approximately 150 | Approximately 155 |
| Sep 2022 | Approximately 130 | Approximately 135 |
| Sep 2023 | Approximately 150 | Approximately 155 |
| Dec 2024 | Approximately 200 | Approximately 215 |
Figure 3 – Annualised tracking error (%, 2020 to 2024) – FTSE North America Phoenix Climate Aligned Index
Source: FTSE Russell, Data as at September 2024
Past performance is no guarantee of future results. Data shown represents hypothetical simulated performance. Please see the end for important legal disclosures.
| Date | Annualised Tracking Error (%) |
|---|---|
| Sep 2020 | 1.5% |
| Early 2021 | 1.6% |
| Sep 2021 | 1.1% |
| Early 2022 | 1.2% |
| Sep 2022 | 1.5% |
| Early 2023 | 1.6% |
| Sep 2023 | 1.6% |
| Early 2024 | 1.4% |
| Sep 2024 | 1.4% |
Leveraging the Transition Pathway
Initiative’s core company assessments The Climate Aligned Index Series is based on FTSE Russell’s Transition Pathway Initiative (TPI) index framework. Used widely in FTSE Russell’s climate transition indices, this framework applies TPIs forward looking assessments of companies’ preparedness for the transition to a low-carbon economy (outlined in more detail below).
TPI is a global initiative led by asset owners and supported by asset managers. It aims to help investor’s assess companies’ preparedness for the transition to a low carbon economy. FTSE Russell has been the data provider to, and a key founding partner of, TPI since 2017. TPI’s two core company assessments provide investors with forward-looking views on company alignment with the goals of the Paris agreement via:
- Management quality: Companies are scored based on their ‘climate governance’ i.e. the extent to which they are demonstrating management of climate transition risks and opportunities. These assessments are aligned with the Taskforce on Climate-related Financial Disclosures’ recommendations.
- Carbon performance: The highest carbon emitting companies are further assessed based on their commitments to decarbonise in line with the expectations of the Paris Agreement. Assessments are sector-specific and provide investors with an indication of company alignment to 1.5°C/below 2°C warming scenarios as well as outcomes that are not aligned to Paris goals.
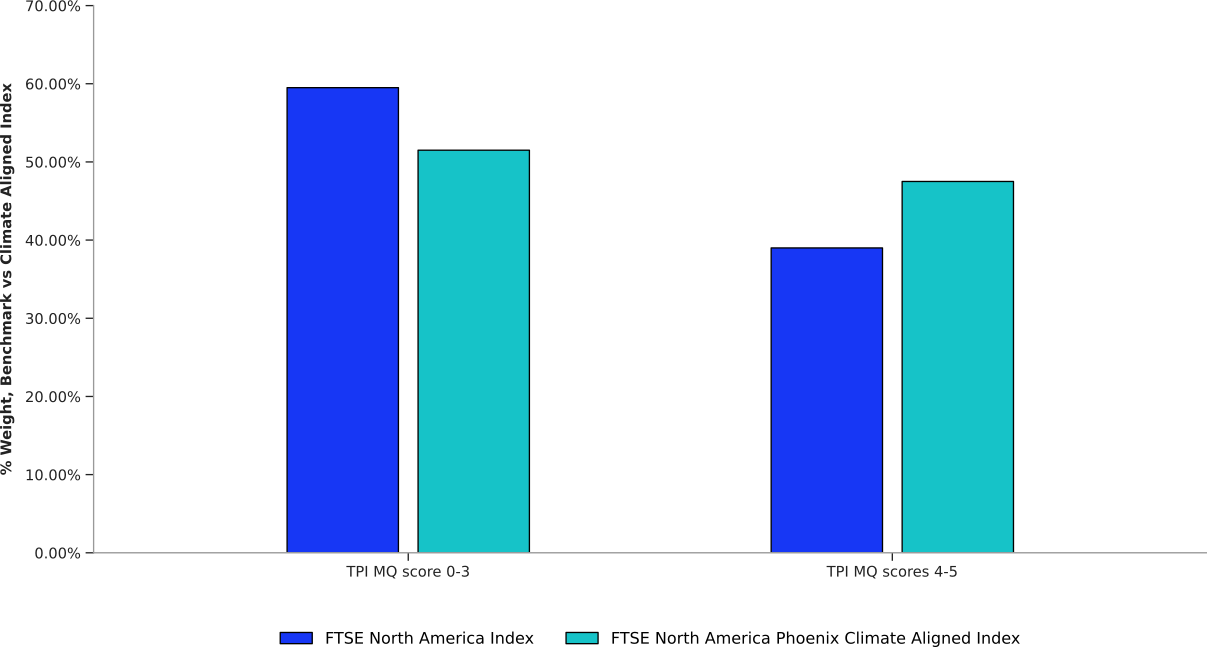
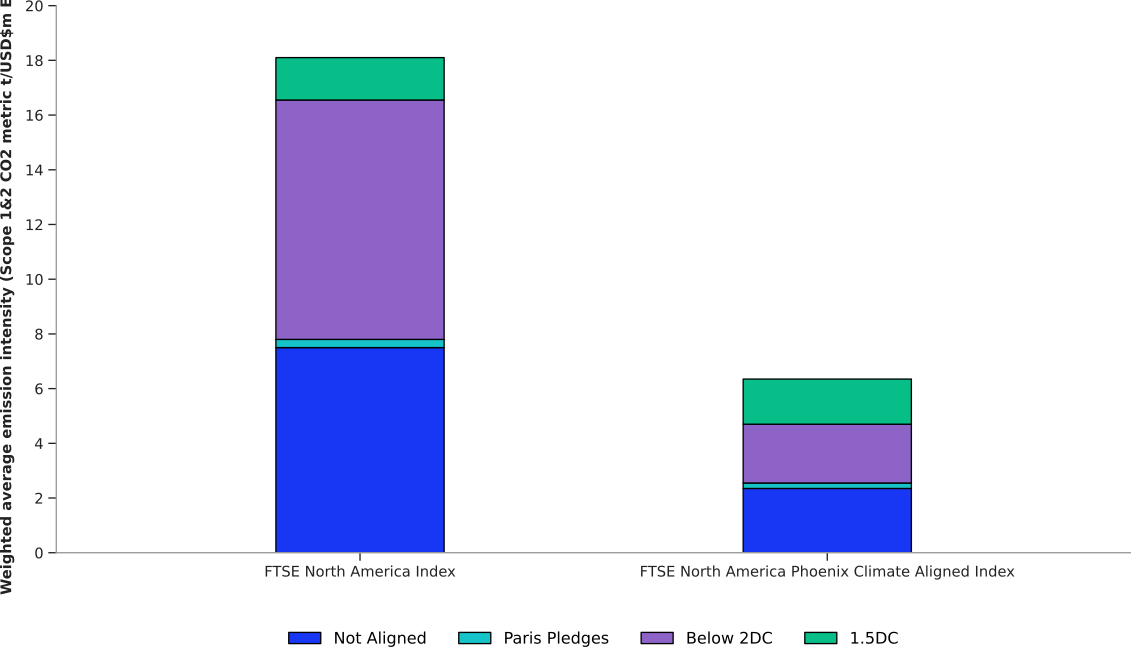
As outlined above, the FTSE Phoenix Climate Aligned Index Series uses TPI company assessments, alongside carbon emissions, green revenues etc. to deliver a set of indices that meet Phoenix Group’s climate and net zero objectives. Using the FTSE North America Phoenix Climate Aligned Index as the example, Figures 4 and 5 (to the right) illustrate how the Phoenix Group index design shifts exposure towards companies with better climate characteristics, in this instance using TPI data as the proxy.
Figure 4 – Exposure to TPI MQ scores (% Weight, Benchmark vs. Climate Aligned Index)
Source: FTSE Russell, Data as at December 2024
| TPI MQ Score Category | FTSE North America Index (%) | FTSE North America Phoenix Climate Aligned Index (%) |
|---|---|---|
| TPI MQ Score 0-3 | 59.5% | 51.5% |
| TPI MQ Score 4-5 | 39.0% | 47.5% |
Figure 5 – Contribution to index emissions intensity – by TPI Carbon Performance category
Source: FTSE Russell, Data as at December 2024
Past performance is no guarantee of future results. Data shown represents hypothetical simulated performance. Please see the end for important legal disclosures.
| TPI Carbon Performance Category | FTSE North America Index | FTSE North America Phoenix Climate Aligned Index |
|---|---|---|
| Not Aligned | 7.5 | 2.5 |
| Paris Pledges | 0.3 | 0.1 |
| Below 2°C | 8.8 | 2.1 |
| 1.5°C | 1.5 | 1.7 |
| Total Emissions Intensity | 18.1 | 6.4 |
IIGCC’s Net Zero Investment Framework in the context of the Phoenix Group/FTSE Climate Aligned approach
Another way to view climate index outcomes is via the IIGCC’s Net Zero Framework (NZIF). Principle-based, NZIF is designed with flexible data selection criteria in mind, enabling investors to use credible sources like TPI to assess asset alignment and build a comprehensive view of portfolio progress. TPI’s Management Quality and Carbon Performance frameworks can be mapped to core NZIF criteria, supporting investors in tracking companies’ net zero alignment. An indicative mapping of TPI climate parameters against NZIF is provided in Table 3 (below), highlighting the overlap between these two frameworks.
Table 3 – Aligning the Net Zero Investment Framework to alternative climate frameworks
| Core NZIF | Definition | TPI metrics that align to NZIF Criteria | Historic or Forward looking? |
|---|---|---|---|
| Ambition | A long term 2050 goal consistent with achieving global net zero. | TPI Management Quality (TPI MQ) indicators that capture a company’s climate policy commitments, including whether it has set long term quantitative targets for reducing its greenhouse gas (GHG) emissions. | Forward |
| Targets | Short- and medium-term science-based targets to reduce GHG emissions. | TPI MQ indicators that capture whether a company has set GHG emission reduction targets, and how specific (i.e. quantitative) they are. In addition, TPI Carbon Performance (TPI CP) analysis identifies, using sector-specific benchmarks, whether company GHG targets are aligned with ambitious temperature scenarios. | Forward |
| Disclosure | Disclosure of operational scope 1, 2 and material scope 3 emissions. | TPI MQ indicators that capture whether companies disclose operational (Scope 1 & 2) carbon emissions and if these data are verified. In addition, TPI MQ indicators that capture company Scope 3 disclosures, and whether these disclosures include material Scope 3 emissions. | Historic |
| Decarbonisation plan* | A quantified set of measures exists to achieve short and medium-term science-based targets by reducing GHGs and increasing green revenues, when relevant. | TPI MQ indicators that capture the extent of company disclosures on the specific actions that will deliver a company’s GHG reduction targets. | Forward |
| Capital allocation alignment* | A clear demonstration that capital expenditures are consistent with achieving net zero by 2050. | TPI MQ indicators that capture company commitments regarding capital allocation that is aligned to decarbonisation commitments. | Forward |
| Emissions performance | Current absolute or emissions intensity is at least equal to a relevant net zero pathway. | TPI Carbon Performance assessments (i.e tracking and benchmarking company decarbonisation outcomes). | Forward |
* Additional alignment criteria that a company/issuer within a high impact material sector needs to meet.
Below are the additional criteria to be incorporated where feasible.
| Climate Policy Engagement/ Climate finance | The company has a Paris-aligned climate lobbying position and demonstrates alignment of its direct and indirect lobbying activities. | TPI MQ indicators that capture whether a company is consistent in its support for international climate action alongside the trade associations that the company supports. | Historic |
|---|---|---|---|
| Climate governance | Clear oversight of net zero transition planning and executive remuneration linked to delivering targets and transition. | TPI MQ indicators that capture a company’s approach to managing climate risks and opportunities, including whether Senior Execs and/or Board members have explicit responsibility for climate and the extent of remuneration arrangements tied to the delivery of company climate commitments. | Forward |
| Just Transition | The company considers the impacts from transitioning to a lower carbon business model on its workers and communities. | N/A | N/A |
| Climate risk and accounts | The company provides disclosures on risks associated with the transition through TCFD reporting and incorporates such risks into its financial accounts. | TPI MQ indicators that capture the extent to which a company includes climate in its strategic planning and risk management processes, and if and how details are included in its climate disclosures | Forward |
Source: FTSE Russell, Data as at December 2024
Engagement through index investing
Linking index selection to active ownership
Given the constraints of passive investing, Phoenix Group places strong emphasis on stewardship and active ownership. This includes:
- Engagement: the TPI assessments create a feedback loop between investment strategy and stewardship activities, helping to identify high-impact companies for targeted engagement.
- Voting: Phoenix Group views voting as a key tool for influence in passive investments, ensuring that shareholder voting aligns with climate objectives.
- Collaboration: Phoenix Group actively participates in industry-wide initiatives and policy advocacy to encourage broader market change.
Phoenix Group has taken this approach to ensure it leverages climate transition benchmarks as not just passive investment tools, but active drivers of corporate decarbonisation efforts.