


Yelyzaveta Kompaniiets

Shehar Aziz

Elaine Arahan
Key takeaways for market analysts
- Netbacks help estimate where value may be highest across destinations
- Utilisation rates indicate whether infrastructure can support additional flows
- Interpreting both together provides a more realistic view of how energy trade flows evolve
As energy security becomes a greater focus, understanding what drives shipping flows is becoming increasingly relevant. Energy cargoes do not always arrive at their original destination. A shipment can change course while already at sea, responding to changing market conditions. Flexible spot cargoes, in particular, can be diverted from one region to another when arbitrage opportunities emerge, allowing traders/professionals to capture higher prices in alternative markets.
For professionals working in commodities and energy, this creates a practical challenge: how are decisions made about where a cargo should go when both prices and physical constraints are constantly shifting?
Two broad types of signals are often considered:
- Destination economics – how pricing influences destination choice
- Infrastructure constraints – whether a destination can physically receive cargo
Understanding how these signals interact can provide useful context for why flows change direction, and what this can indicate about wider energy market dynamics.
How do professionals assess destination economics in energy markets?
When comparing potential destinations, professionals often need a simple way to assess commercial attractiveness. One commonly used approach is to consider netbacks.
Rather than being treated as a strict formula, netbacks are often viewed as a summary of potential destination profitability. They bring together key elements such as market prices and transport costs into a single, comparable view of potential value across destinations. However, the results can vary depending on the assumptions and methodology used.
In LNG markets, netbacks are calculated by subtracting voyage costs from the landed price. Depending on the approach, costs related to regasification and feedgas may be excluded.
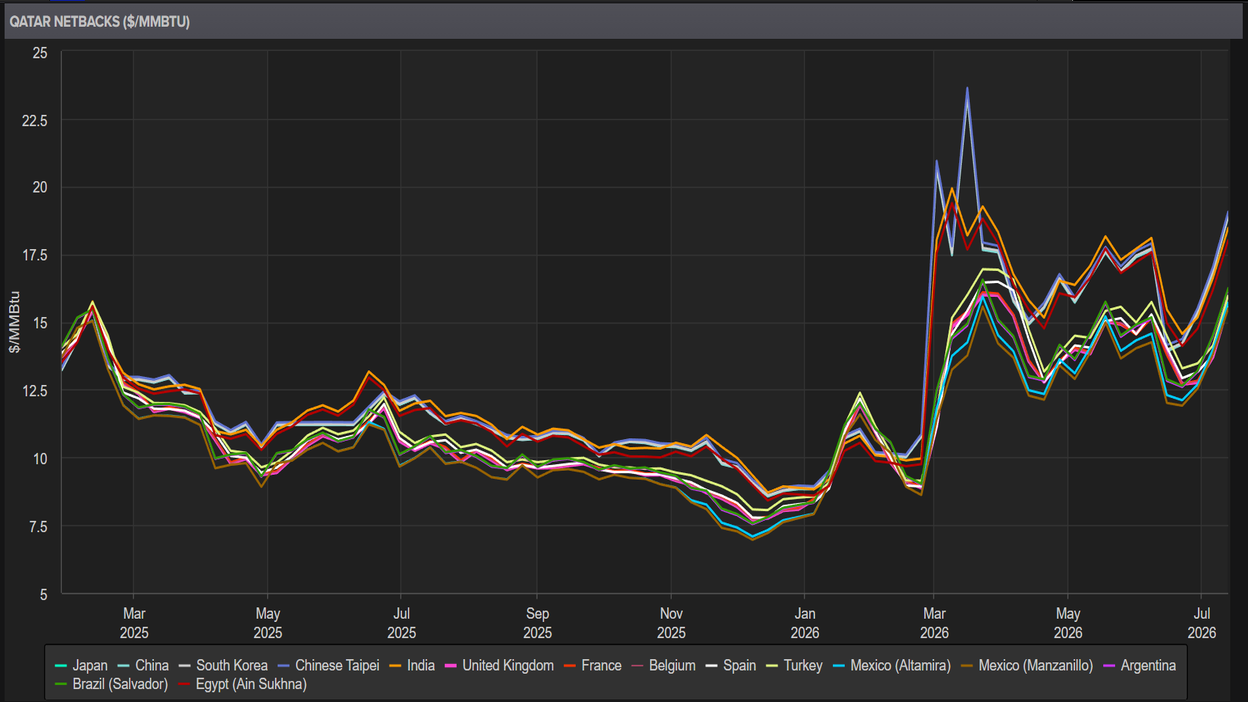
Source: LSEG Workspace
This chart shows historical changes in netback prices, which may be viewed alongside significant world events.
In oil and refined products markets, netbacks are used to compare the value of refined products with the underlying crude input. They may also be considered alongside refinery margins as an indicative view of value generation within the refining process.
Why do infrastructure constraints matter in energy trade flows?
To integrate an additional layer into shipping flows, it is also important to consider infrastructure constraints, specifically, the utilised capacity of energy facilities, often referred to as the utilisation rate.
Utilisation rates indicate how much of a facility’s total capacity is currently in use, providing a straightforward way to assess the level of available spare capacity.
Infrastructure constraints can be an important factor alongside netbacks when determining cargo destination decisions. In some cases, facility capacity may be booked several months in advance. Alternatively, refining facilities may experience unexpected outages that limit their ability to receive additional cargo. Unplanned outages and planned maintenance in oil and refined products markets can be monitored using industry data sources, such as Industrial Info Resources (IRR) data available in LSEG Workspace, which covers outages at a unit level for more than 700 refineries around the globe.
As a result, even where netbacks appear favourable, limited available capacity can restrict the ability to import more products.
For this reason, professionals often assess price signals and system capacity together, rather than relying on either one in isolation.
How do netbacks and capacity interact in LNG trade flows?
In some instances, the utilisation rates of LNG infrastructure may exceed 100%. This occurs when terminals and plants temporarily operate above their nameplate capacity under certain conditions. For example, facilities, such as Zeebrugge in Belgium, may process volumes beyond their stated regasification capacity over short periods by utilising operational flexibility and optimising throughput.
As a result, readings above 100% typically signal tighter operating conditions, rather than a permanent increase in capacity.
Capacity definitions can also vary. In the United States, for example, facilities may operate under both baseload and maximum authorised capacity levels. Comparing utilisation across these metrics helps assess whether spare capacity could be available.
To extend this analysis, shipping flow data, available in tools such as the Flows app in LSEG Workspace, can help track current and past flows and monitor shipments reaching a given location.
Overall, netbacks and utilisation rates reflect different aspects of LNG flows. When considered together, they may help inform a more nuanced interpretation of how pricing signals and infrastructure availability could influence potential cargo destination decisions.
What factors should be considered when interpreting energy market signals?
While netbacks and utilisation rates are valuable signals, they can be misinterpreted when viewed in isolation. Some common considerations include:
- Capacity constraints are not always captured by price signals
A higher netback does not necessarily mean a destination can accommodate additional cargo.
- Utilisation levels are not fixed
Capacity may vary depending on operational flexibility, infrastructure, and regulatory conditions.
- Short-term movements do not always reflect broader trends
Both price signals and utilisation levels can change quickly and may be better interpreted alongside wider market developments.
Recognising these limitations can support a more balanced interpretation of flow dynamics.
Further learning on energy markets
These dynamics are explored further in a recently conducted webinar, which examined how these signals play out across real market scenarios.
Building on this, related learning pathways covering oil and products markets, alongside training videos focused on gas markets, provide additional context.
Legal Disclaimer
Republication or redistribution of LSE Group content is prohibited without our prior written consent.
The content of this publication is for informational purposes only and has no legal effect, does not form part of any contract, does not, and does not seek to constitute advice of any nature and no reliance should be placed upon statements contained herein. Whilst reasonable efforts have been taken to ensure that the contents of this publication are accurate and reliable, LSE Group does not guarantee that this document is free from errors or omissions; therefore, you may not rely upon the content of this document under any circumstances and you should seek your own independent legal, investment, tax and other advice. Neither We nor our affiliates shall be liable for any errors, inaccuracies or delays in the publication or any other content, or for any actions taken by you in reliance thereon.
Copyright © 2026 London Stock Exchange Group. All rights reserved.
The content of this publication is provided by London Stock Exchange Group plc, its applicable group undertakings and/or its affiliates or licensors (the “LSE Group” or “We”) exclusively.
Neither We nor our affiliates guarantee the accuracy of or endorse the views or opinions given by any third party content provider, advertiser, sponsor or other user. We may link to, reference, or promote websites, applications and/or services from third parties. You agree that We are not responsible for, and do not control such non-LSE Group websites, applications or services.
The content of this publication is for informational purposes only. All information and data contained in this publication is obtained by LSE Group from sources believed by it to be accurate and reliable. Because of the possibility of human and mechanical error as well as other factors, however, such information and data are provided "as is" without warranty of any kind. You understand and agree that this publication does not, and does not seek to, constitute advice of any nature. You may not rely upon the content of this document under any circumstances and should seek your own independent legal, tax or investment advice or opinion regarding the suitability, value or profitability of any particular security, portfolio or investment strategy. Neither We nor our affiliates shall be liable for any errors, inaccuracies or delays in the publication or any other content, or for any actions taken by you in reliance thereon. You expressly agree that your use of the publication and its content is at your sole risk.
To the fullest extent permitted by applicable law, LSE Group, expressly disclaims any representation or warranties, express or implied, including, without limitation, any representations or warranties of performance, merchantability, fitness for a particular purpose, accuracy, completeness, reliability and non-infringement. LSE Group, its subsidiaries, its affiliates and their respective shareholders, directors, officers employees, agents, advertisers, content providers and licensors (collectively referred to as the “LSE Group Parties”) disclaim all responsibility for any loss, liability or damage of any kind resulting from or related to access, use or the unavailability of the publication (or any part of it); and none of the LSE Group Parties will be liable (jointly or severally) to you for any direct, indirect, consequential, special, incidental, punitive or exemplary damages, howsoever arising, even if any member of the LSE Group Parties are advised in advance of the possibility of such damages or could have foreseen any such damages arising or resulting from the use of, or inability to use, the information contained in the publication. For the avoidance of doubt, the LSE Group Parties shall have no liability for any losses, claims, demands, actions, proceedings, damages, costs or expenses arising out of, or in any way connected with, the information contained in this document.
LSE Group is the owner of various intellectual property rights ("IPR”), including but not limited to, numerous trademarks that are used to identify, advertise, and promote LSE Group products, services and activities. Nothing contained herein should be construed as granting any licence or right to use any of the trademarks or any other LSE Group IPR for any purpose whatsoever without the written permission or applicable licence terms.
