

Richard Ng

Leon Roisenberg
- The current market concentration from the “Magnificent Seven” exceeds the record levels from the Dot Com Bubble and Global Financial Crisis. They have delivered strong returns - but some market participants expect a mean reversion.
- The “Magnificent Seven” are Growth stocks in terms of Style and Quality in terms of Factor. Backdrops are different in various periods but Value outperformed post the Dot Com Bubble and the previous top seven stocks went separate paths post Bubble.
- Russell Style Indexes give investors the ability to express their view on the “Magnificent Seven,” while capped indexes can alleviate concentration.
Seven mega-cap Technology and Consumer Discretionary stocks, Amazon, Apple, Google (Alphabet), Meta, Microsoft, Nvidia and Tesla, dubbed the “Magnificent Seven”, led the US equity market in 2023 due to an AI boom amid a stabilizing economy. They have contributed around 94% of the Russell 1000 Index return YTD as of end of October. This dominance resulted in a very concentrated market with the “Magnificent Seven” comprising over 25% of Russell 1000 Index weight, the highest in recent history.
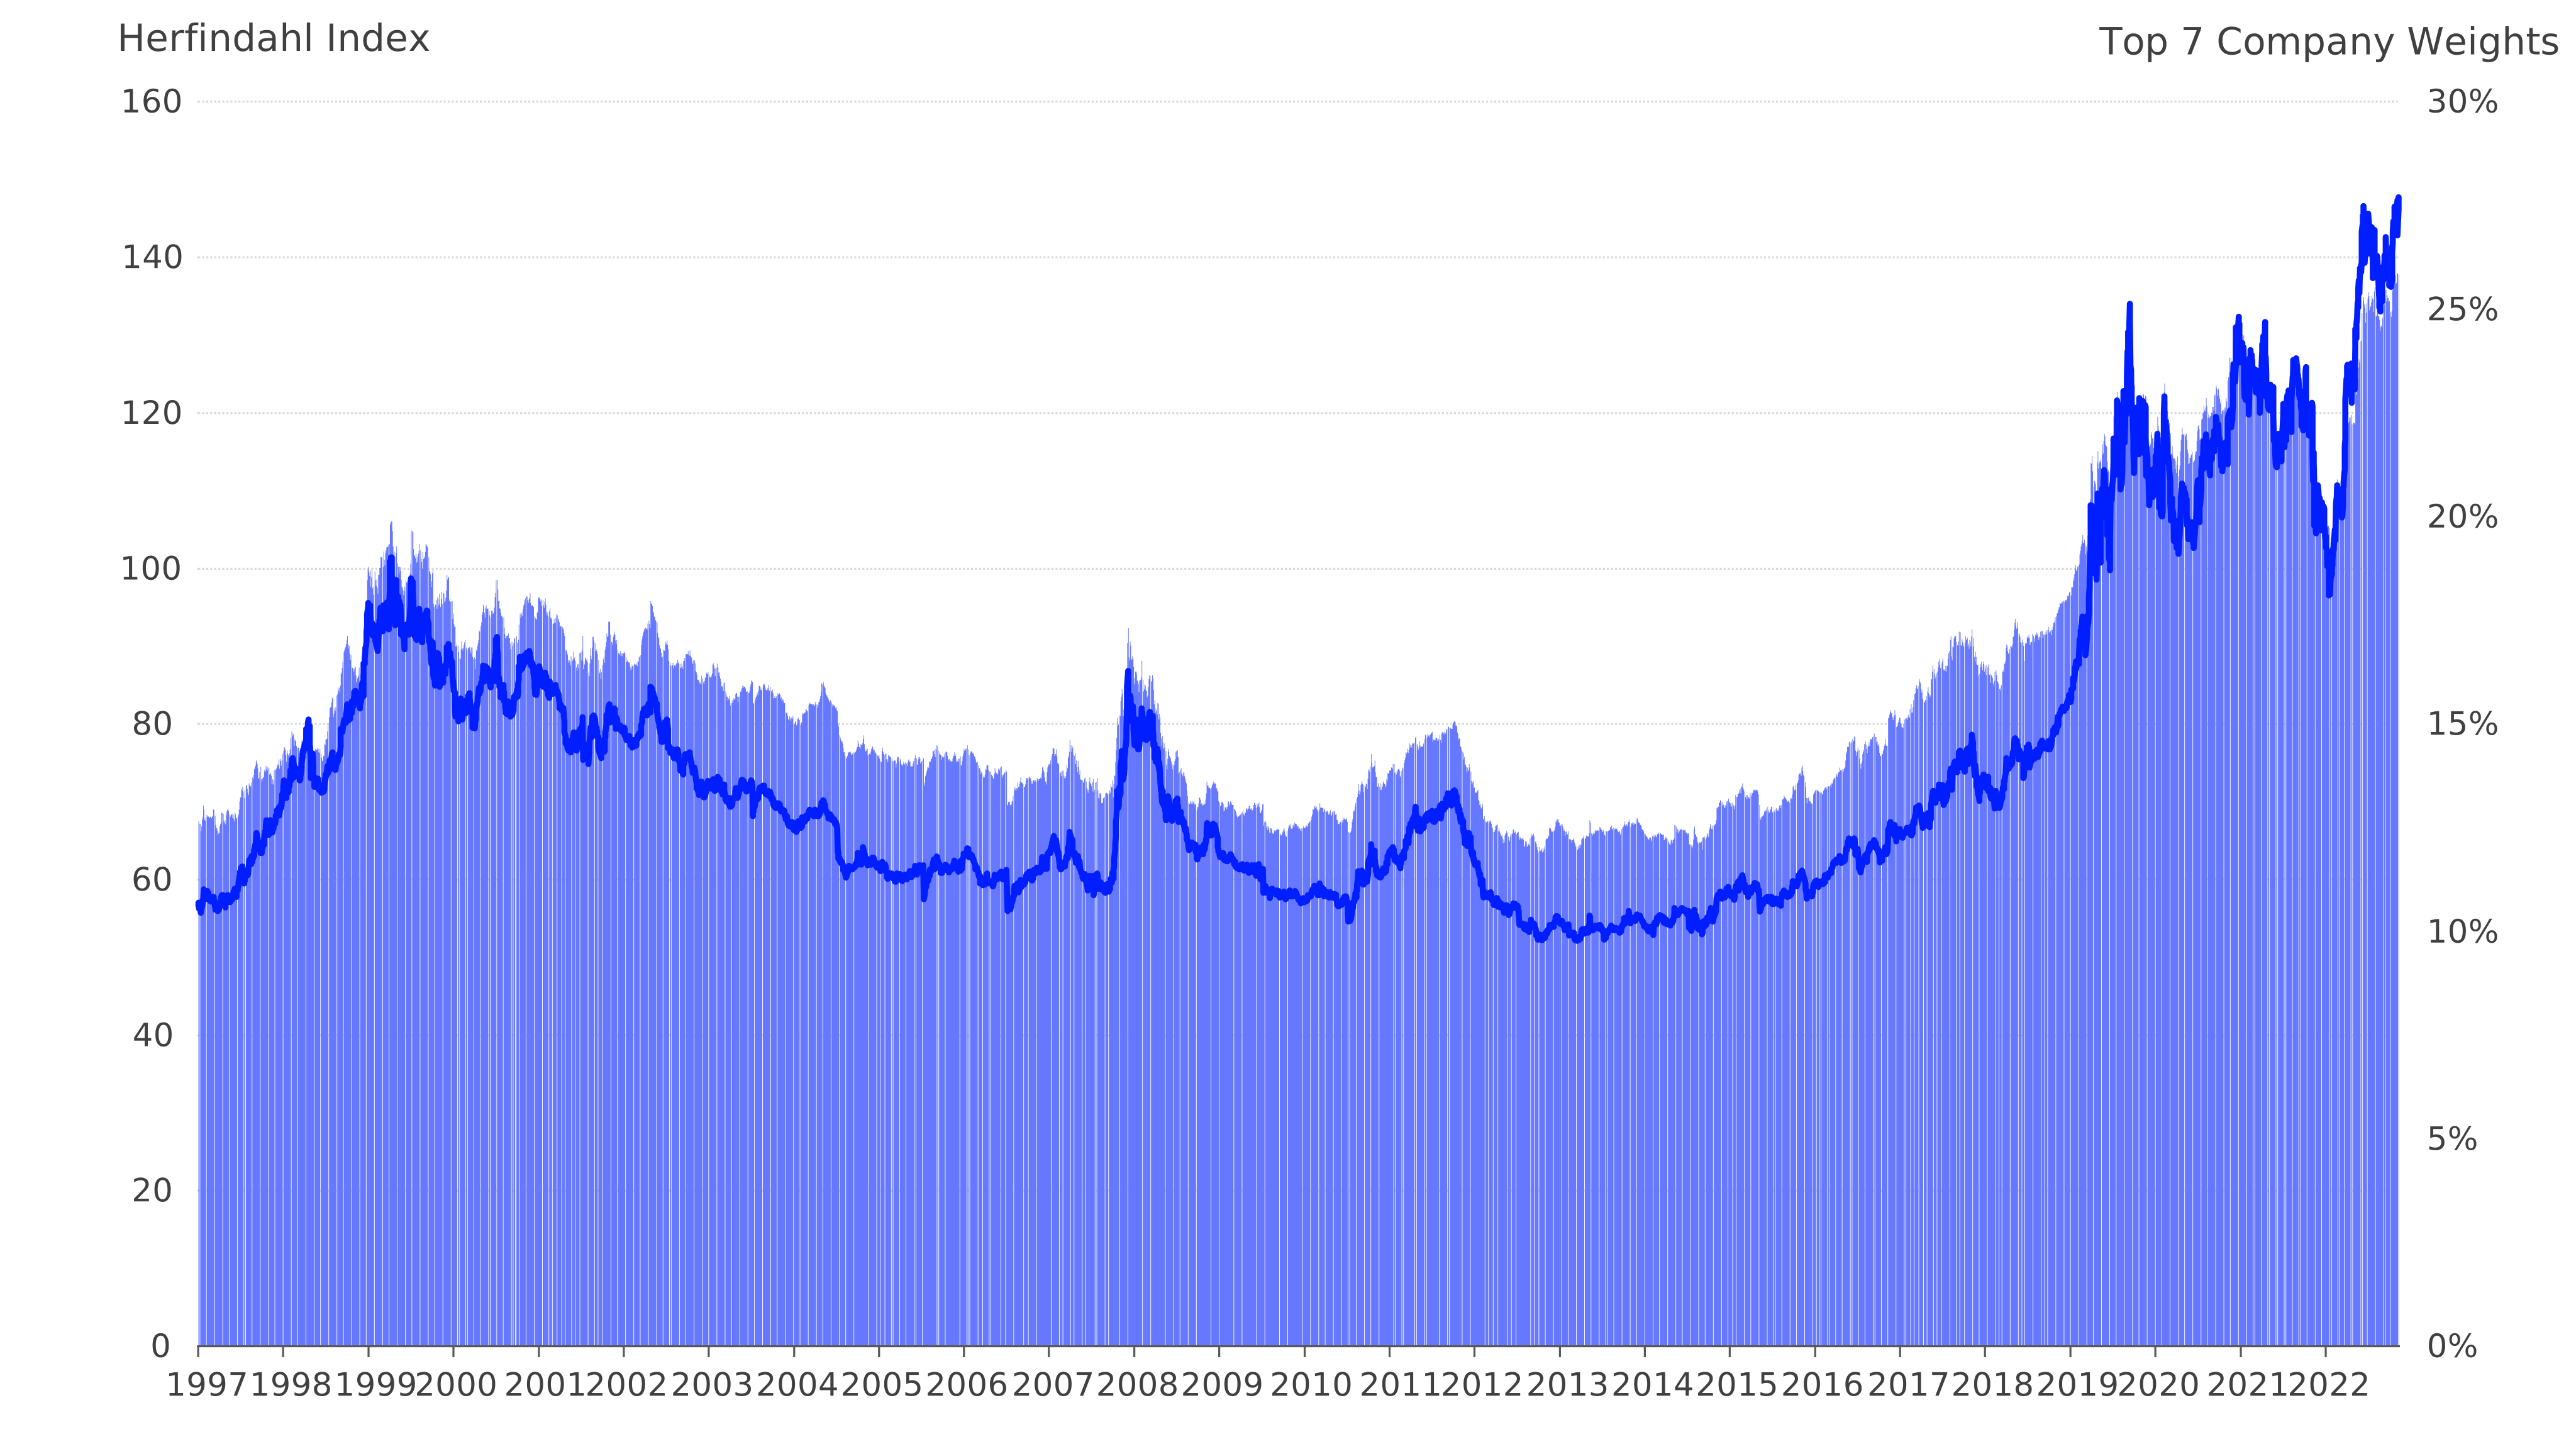
To get a sense of how concentrated the current market is, we look at the Herfindahl index using Russell 1000 to represent the US large cap stock market. The Herfindahl index can range from close to 0 to 10000, with lower values indicating a less concentrated market. (line chart below, left scale).
US Large Cap Equity Market Concentration
Source: FTSE Russell, November 2023. Past performance is no guarantee to future results. Please see the end for important disclosures.
As shown in the chart above, the index ranges from 100 to almost 150 in the more recent period from year 2020 and stayed above 110 for much of the period and reached the highest levels this year. The most recent concentration dominates the previous peak during the Dot Com Bubble, where the index briefly exceeded 100 and declined after the Bubble burst. The period around the Global Financial Crisis in 2008 also saw elevated market concentration, but not as high as the two aforementioned periods.
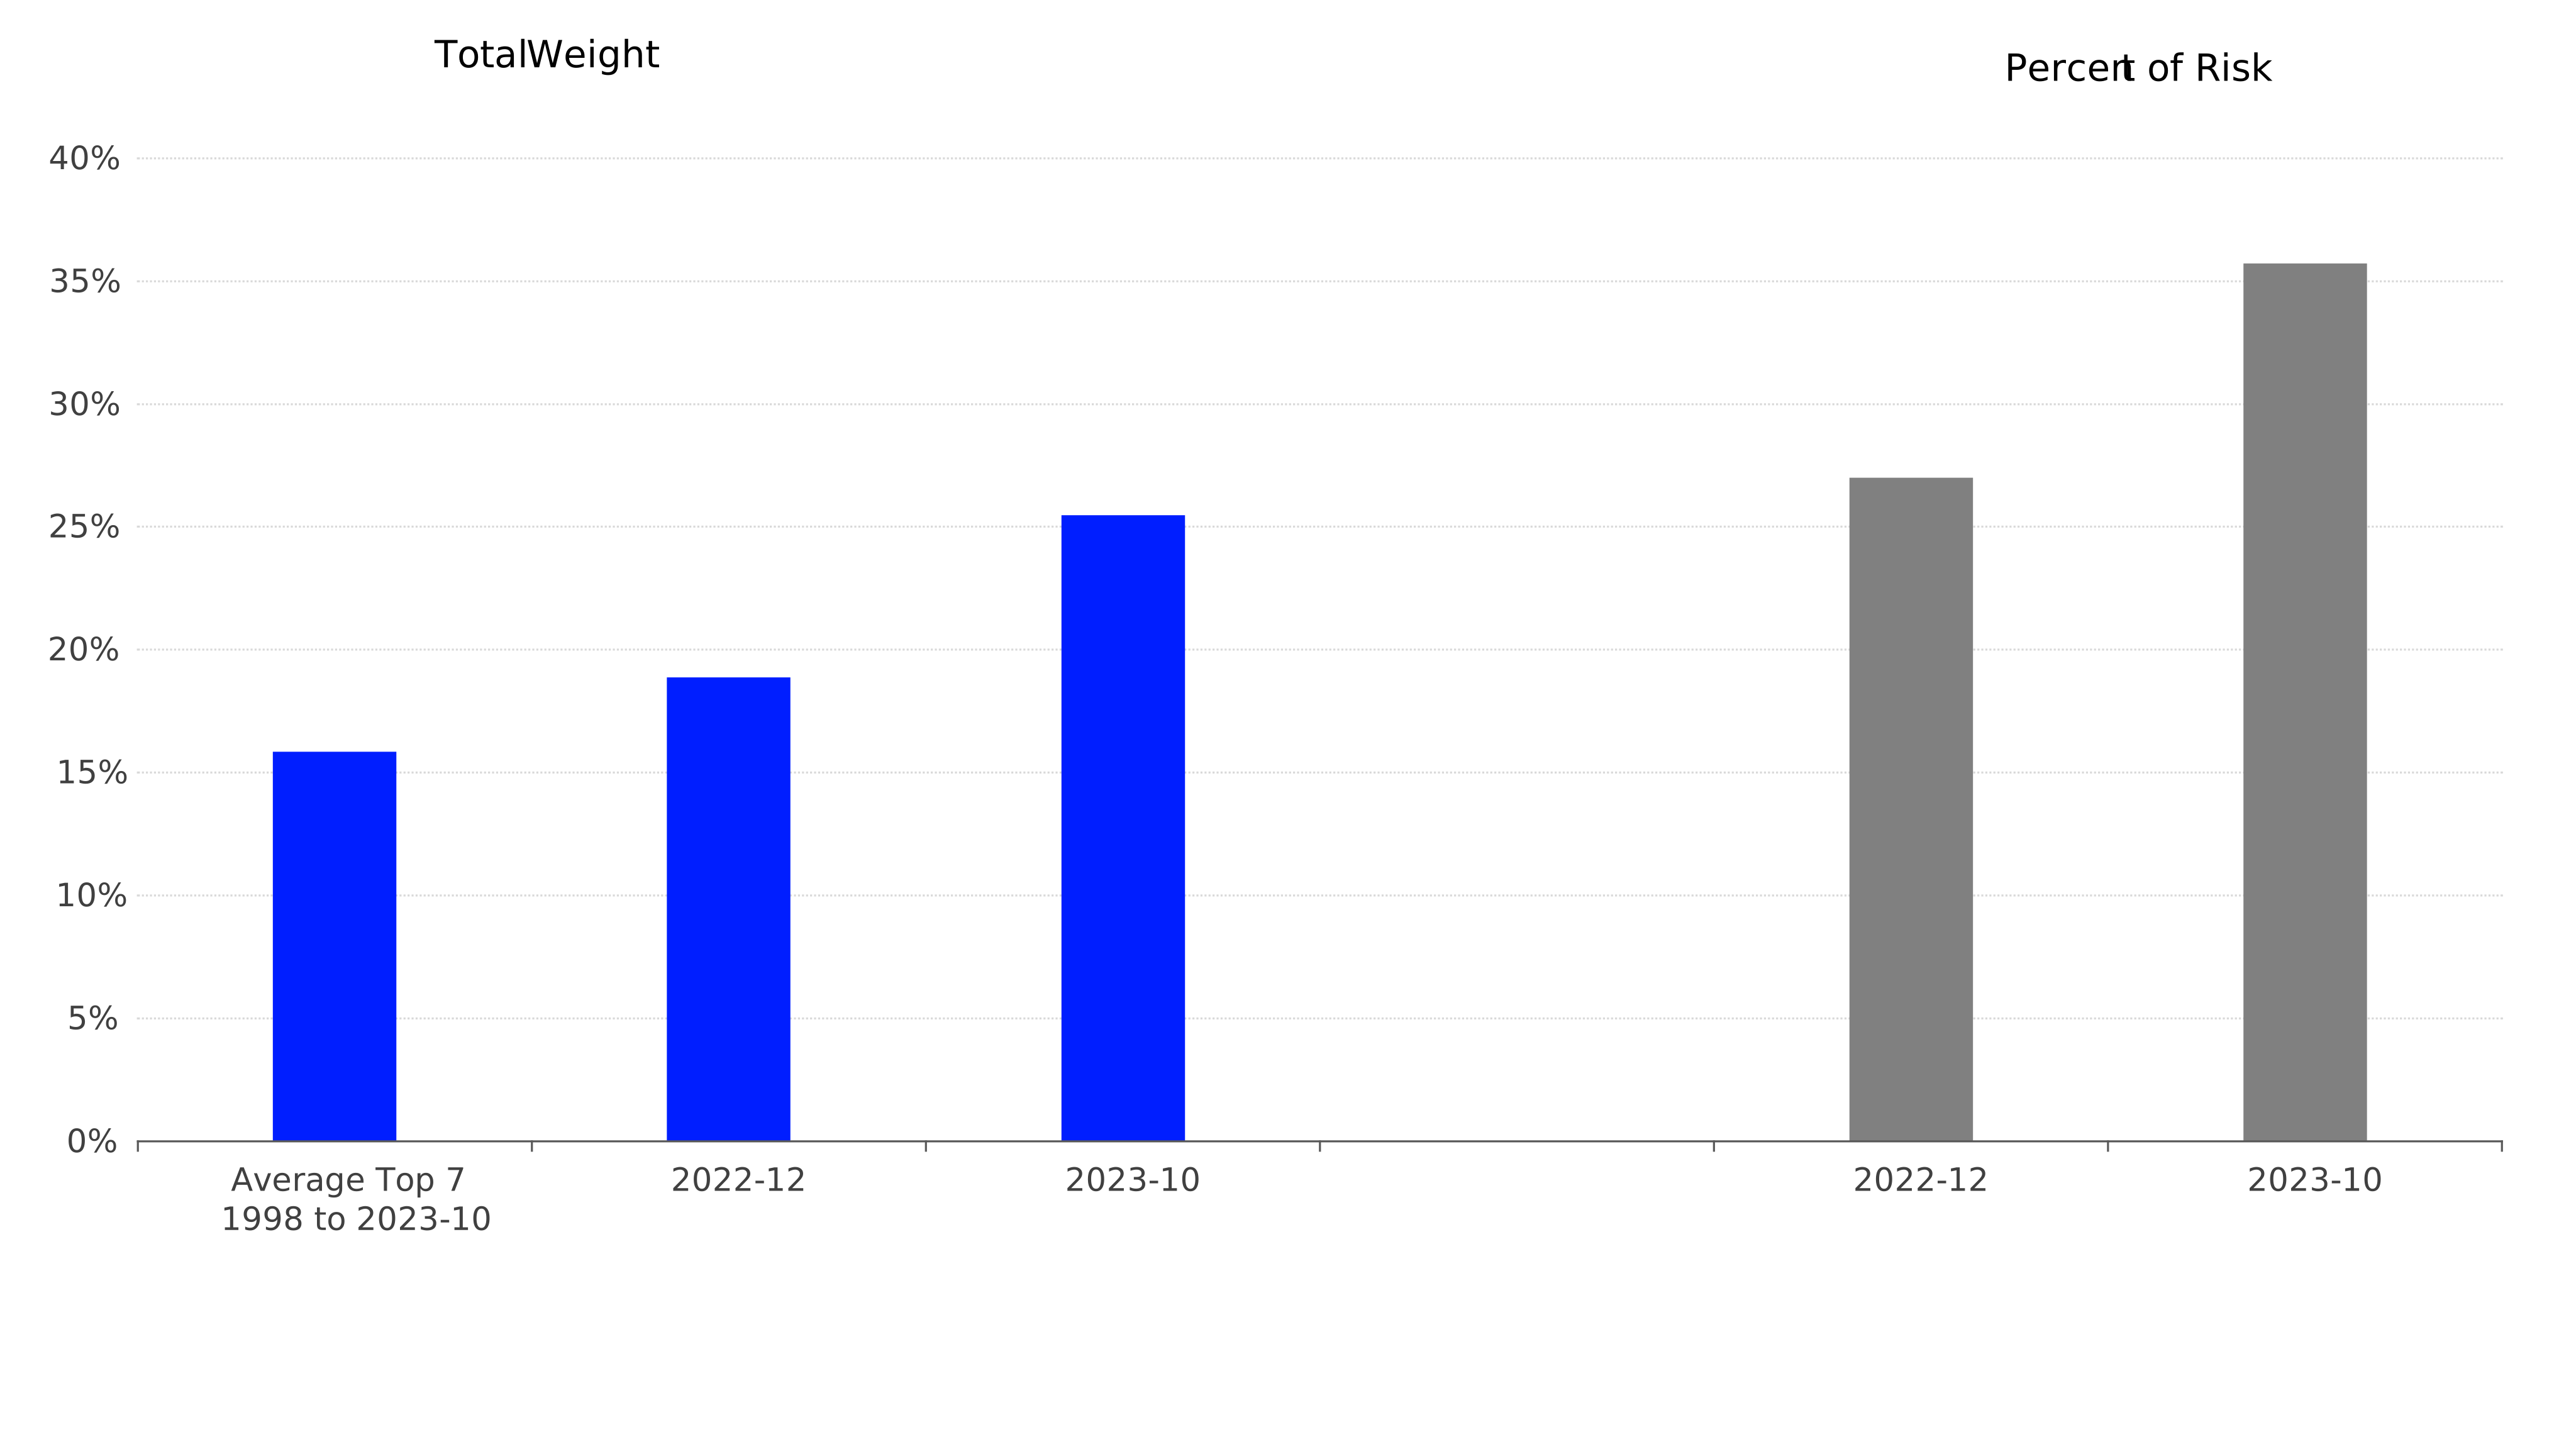
Looking at the top seven company weights (area chart above, right scale), they are largely in line with the Herfindahl index and provide another metric showing the current market concentration being the highest during this century. The ‘Magnificent Seven’ accounted for 25.5% of the Russell 1000 Index vs. the long-term average of 15.5% for top 7 stocks during the period from 1998 through October of this year (see chart below). Even more striking, as the chart below shows, is the “Magnificent Seven”’s contribution to the Russell 1000 Index risk of 36% is even larger than their record weight.
"Magnificent Seven" - Total Weight vs. Percent of Risk
Source: FTSE Russell, November 2023. Past performance is no guarantee to future results. Please see the end for important disclosures,
Such extreme market concentration may be unsustainable and result in sharp reversal. Investors face a difficult choice between participating in extraordinary returns of the “Magnificent Seven”, should they continue, and avoiding the risks that come with an overly concentrated portfolio.
Looking at these Seven through style analysis as well as factor lens, they are essentially growth stocks in terms of style and quality in terms of factor. They are 100% in Russell 1000 Growth Index and high in quality score given high profitability and low leverage employed, e.g. in table below, Apple scores better than 98% of stocks in the Russell 1000 Index in terms of quality.
| 2023 | 2000 | ||||||
| Russell 1000 Weight | R1000 Growth Probability | Quality | Russell 1000 Weight | R1000 Growth Probability | Quality | ||
| Apple | 6.95% | 100% | 98% | GE | 3.97% | 100% | 45% |
| Microsoft | 6.22% | 100% | 90% | Cisco | 3.46% | 100% | 75% |
| Alphabet | 3.39% | 100% | 92% | Intel | 3.42% | 100% | 74% |
| Amazon | 2.91% | 100% | 59% | Microsoft | 2.40% | 100% | 51% |
| Nvidia | 2.50% | 100% | 86% | Exxon Mobil | 2.09% | 0% | 77% |
| Tesla | 1.77% | 100% | 88% | IBM | 1.49% | 82% | 33% |
| Meta | 1.59% | 100% | 81% | Lucent | 1.45% | 100% | 28% |
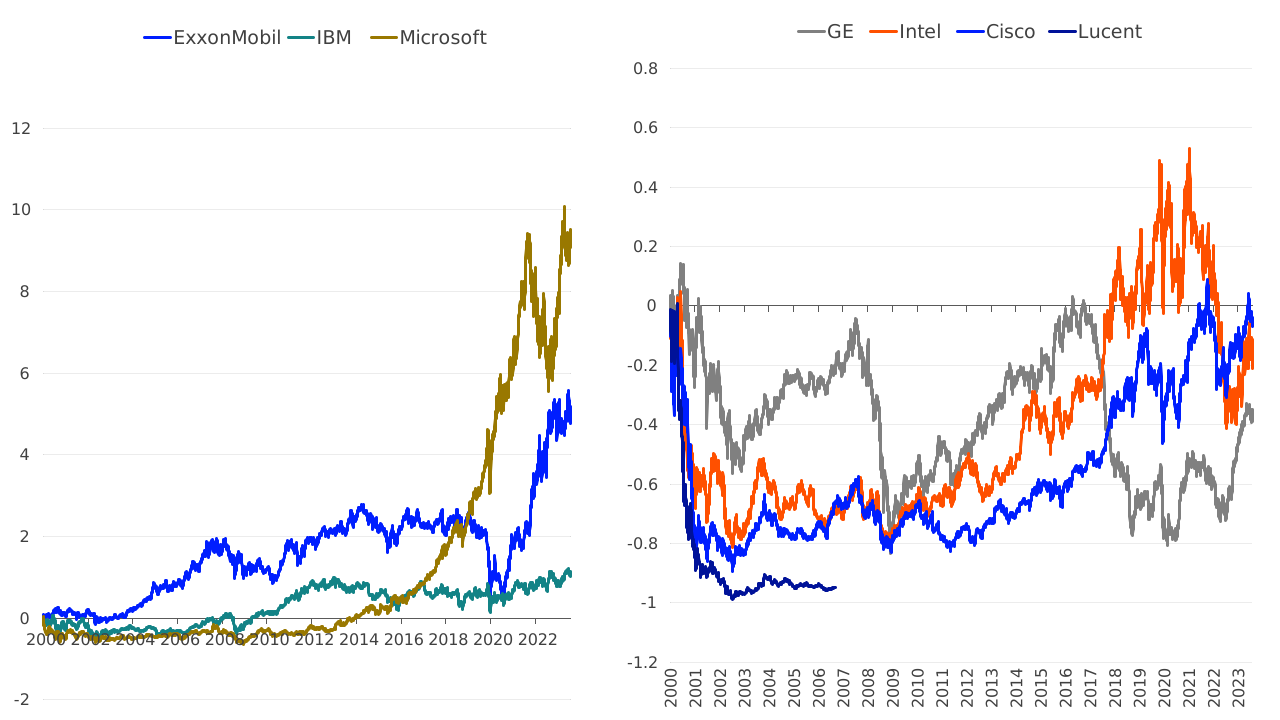
While history may not repeat itself, we looked at the Dot Com Bubble period that had the 2nd highest stock concentration to get an idea about sustainability of extraordinary performance. The top seven stocks then were GE, Cisco, Intel, Microsoft, ExxonMobil, IBM, and Lucent. In that case, all were growth stocks, except ExxonMobil, which was value. ExxonMobil, Cisco, Intel had the highest quality score and Lucent the lowest. After the Dot Com Bubble period, it was a tale of multiple stories. While Microsoft did not perform well until 2014 and now back in top seven, ExxonMobil has perfor,med well since then (especially with the recent surge in oil price). Lucent no longer exists.
Cumulative Return
Source: FTSE Russell, November 2023. Past performance is no guarantee to future results. Please see the end for important disclosures.
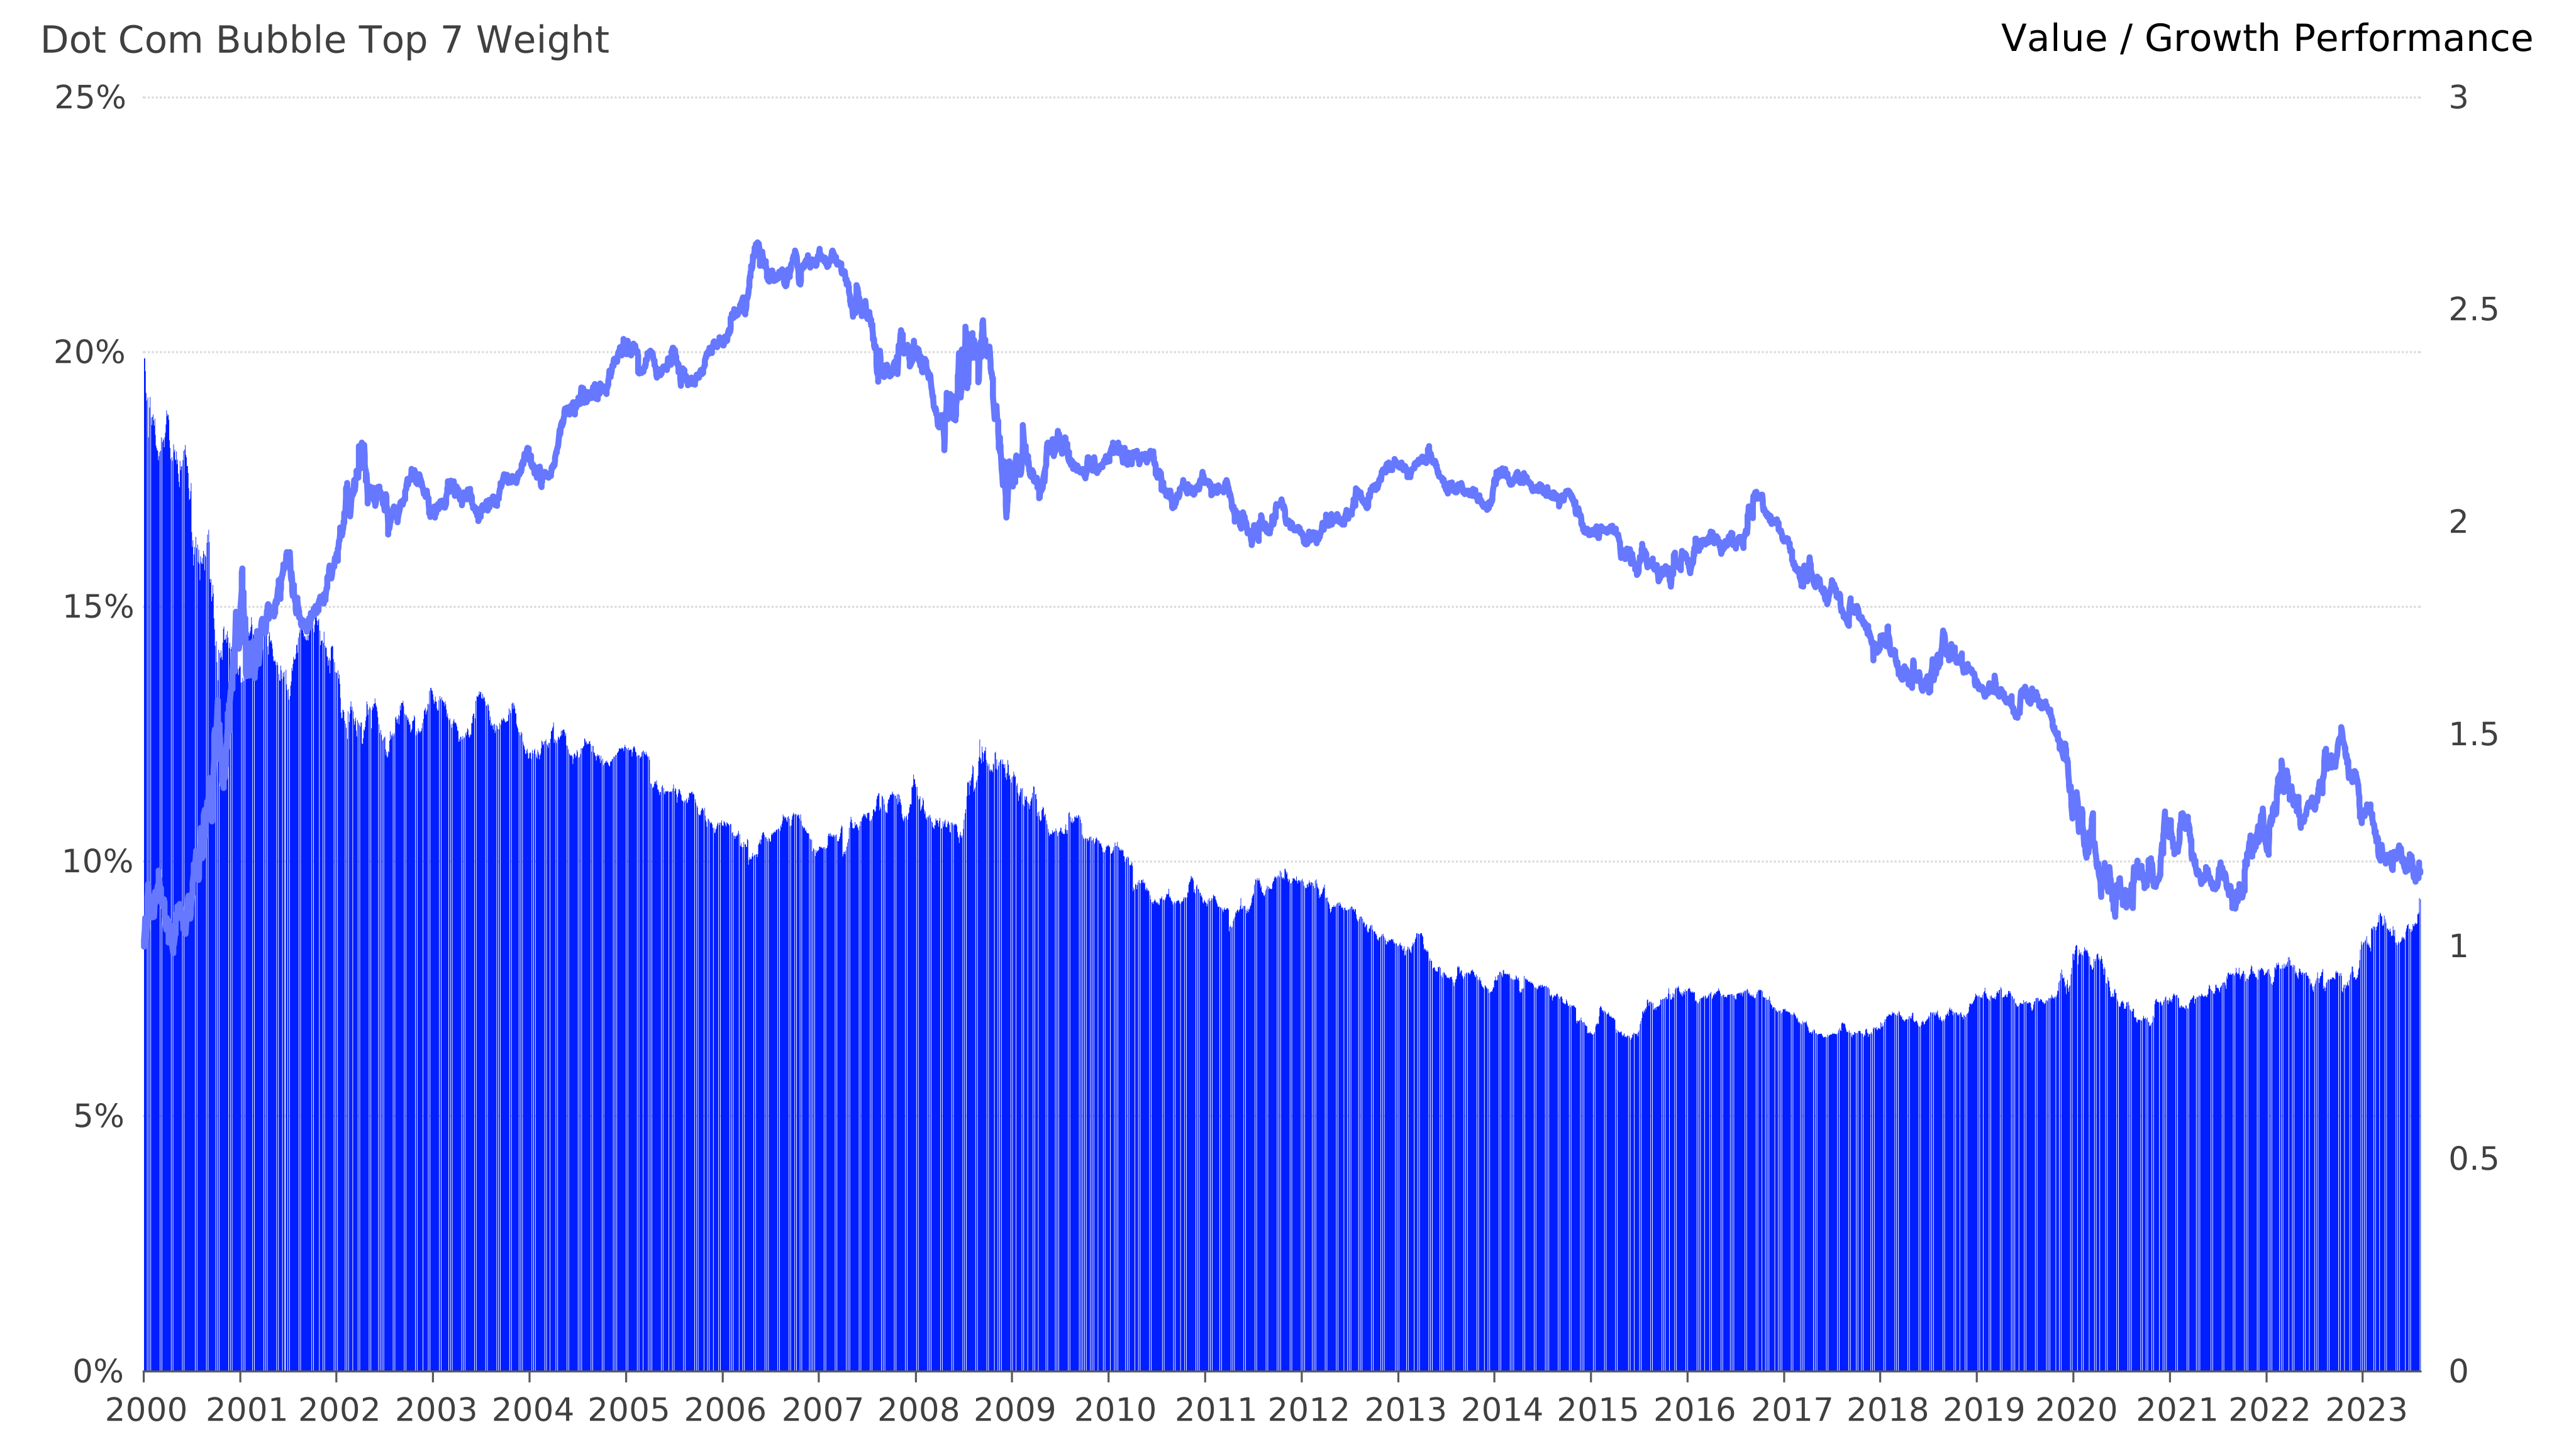
As a meaning reverting story, overall, concentration of the previous top seven stocks has then come down from 20% to less than 10% (area chart, left scale in chart below). And Russell 1000 Value has outperformed Russell 1000 Growth after the Dot Com Bubble (line chart, right scale in chart below).
Largest 7 Stock Weight and Style Performance after the Dot Com Bubble
Source: FTSE Russell, November 2023. Past performance is no guarantee to future results. Please see the end for important disclosures.
Russell 1000 Value and Growth Indexes split the Russell 1000 into two distinct styles. They provide investment alternatives based on investor outlook for continuation of “Magnificent Seven” performance going forward. Chart below shows that the Seven currently reside entirely in the Russell 1000 Growth Index and account for almost 50% of its weight and 60% of its risk and are absent from the Russell 1000 Value Index.
"Magnificent Seven" - Total Weight vs. Percent of Risk
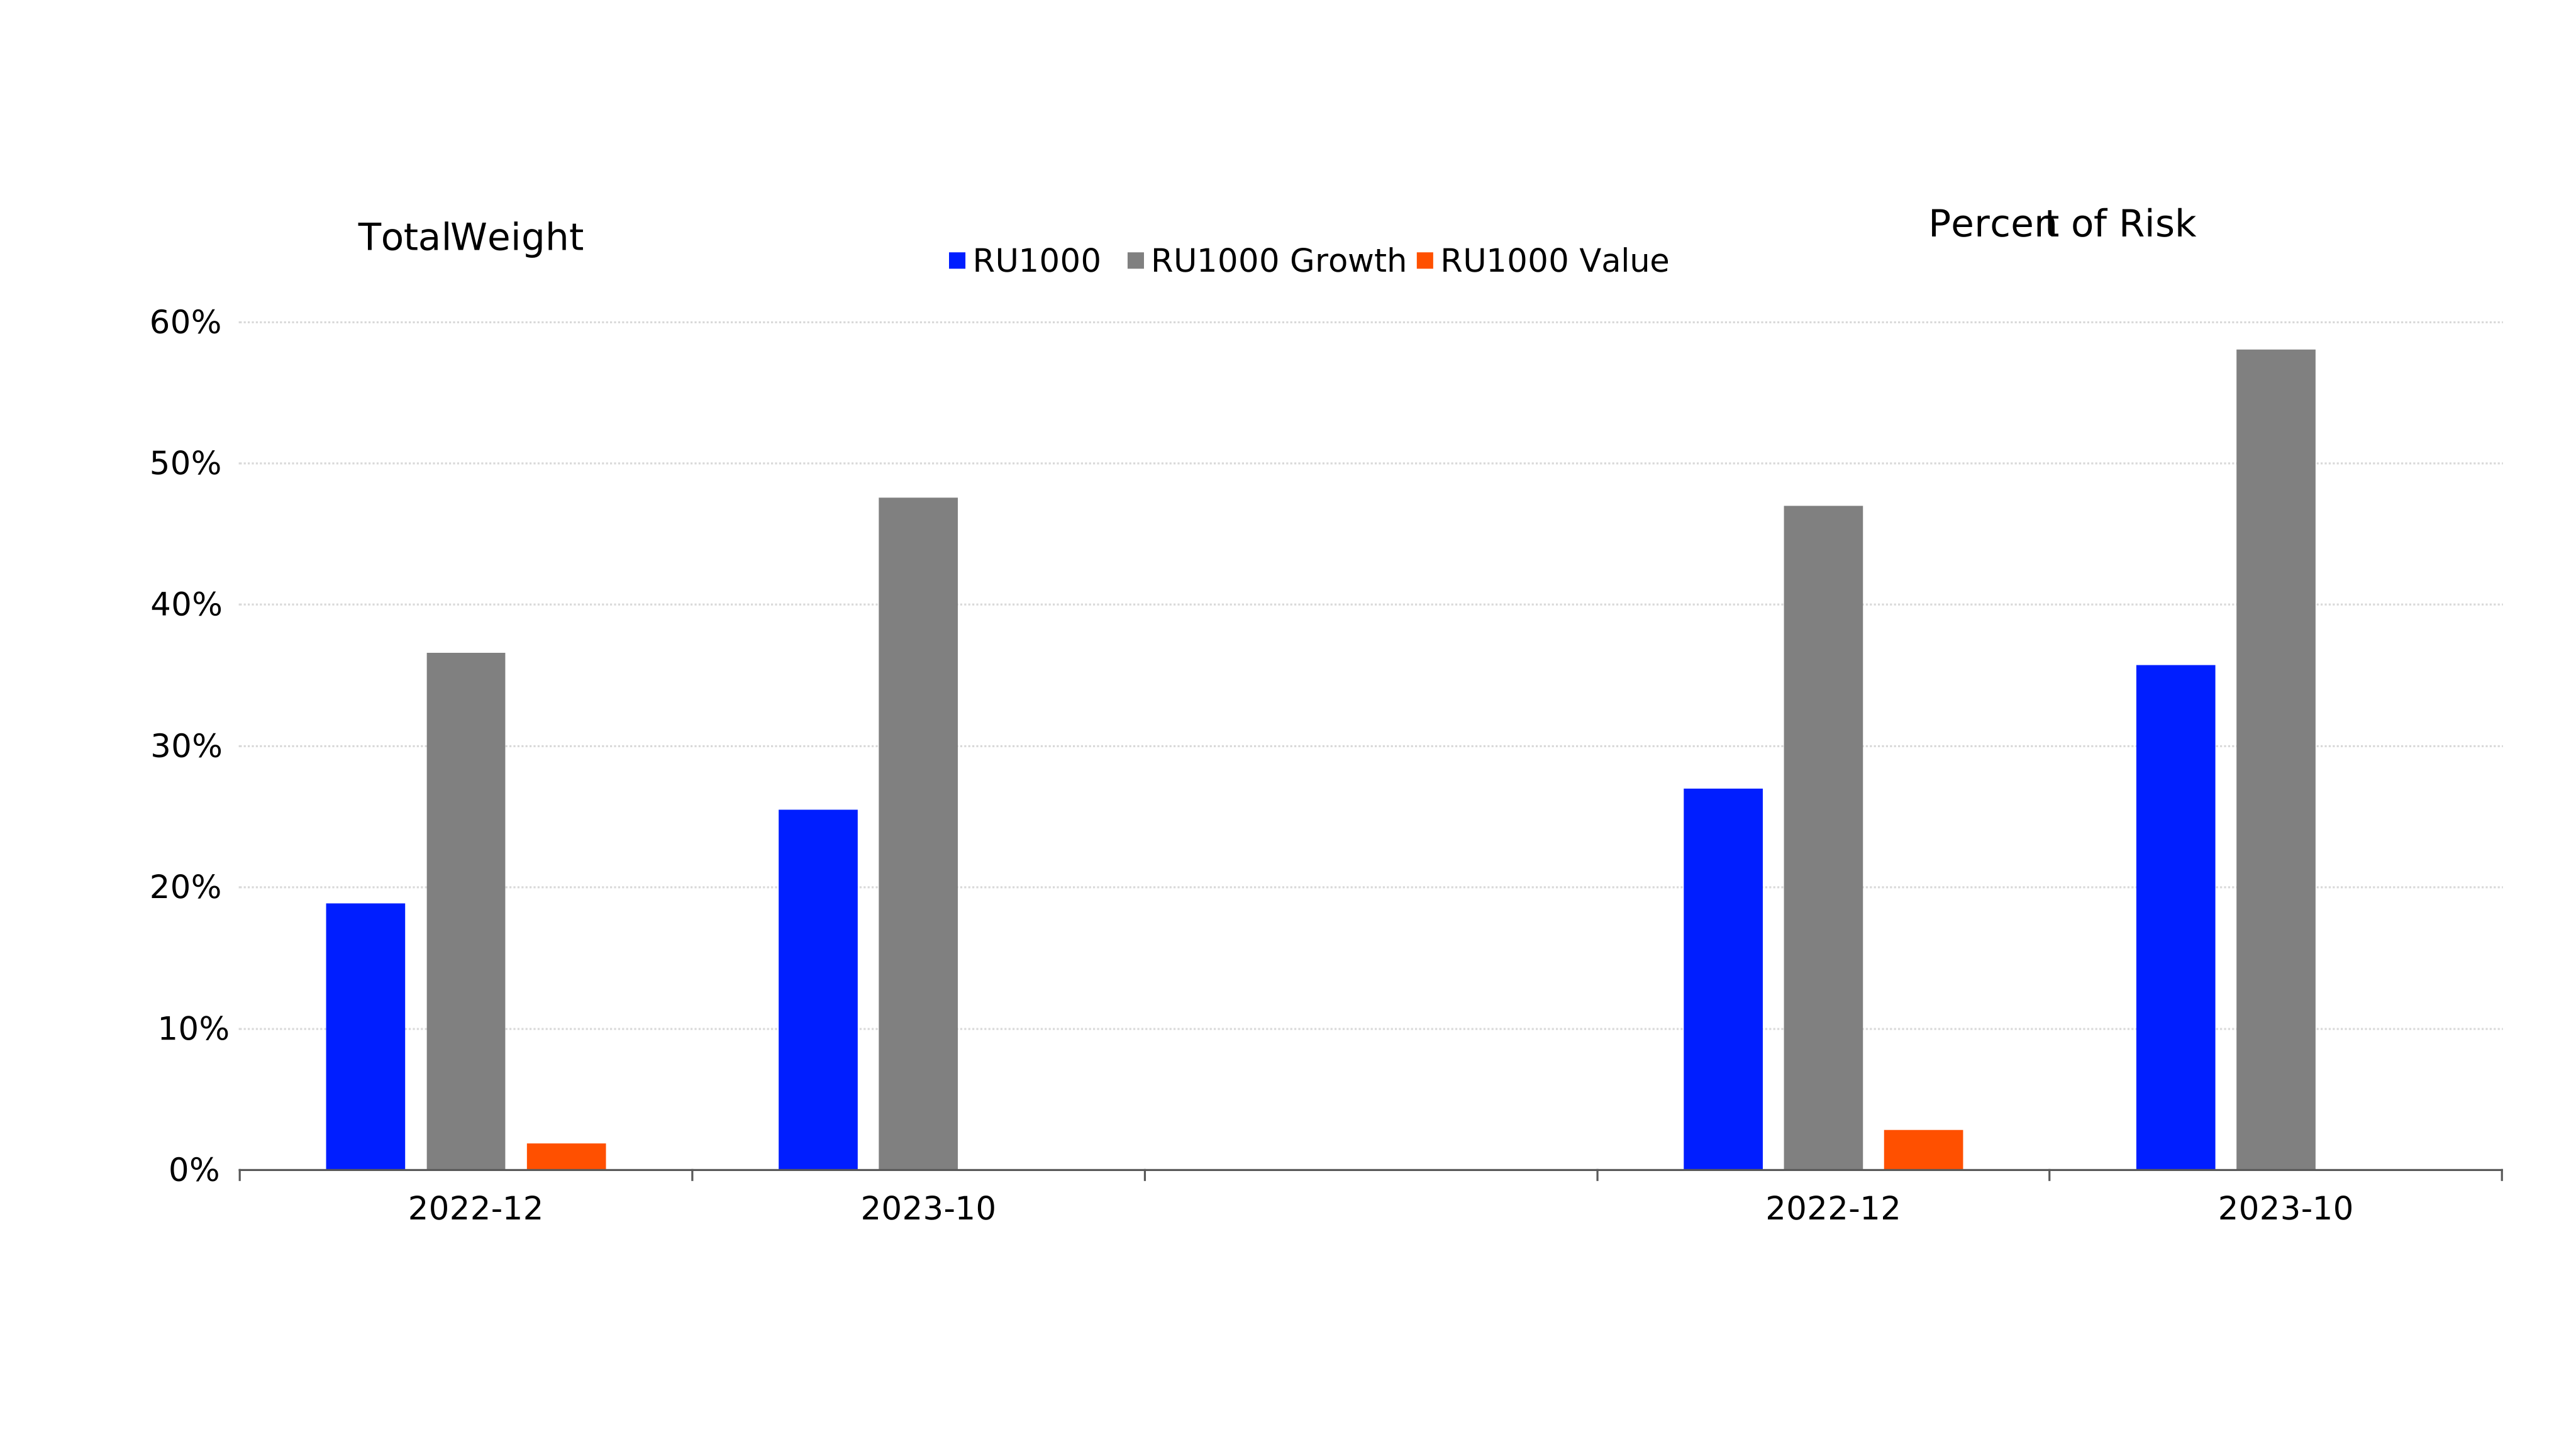
Source: FTSE Russell, November 2023. Past performance is no guarantee to future results. Please see the end for important disclosures.
Furthermore, FTSE Russell has recently launched capped indexes to address concentration risks, which cover Russell 1000 Industry Classification Benchmark (ICB) Indexes. Capped indexes limit weights of the “Magnificent Seven” in the ICB indexes. (Technology and Consumer Discretionary Indexes)
With the US stock market currently experiencing the highest market concentration in recent history, with the Seven comprising over 25% of market cap weight, 36% of risk, and 94% of Russell 1000 return YTD as of October 2023, they have been fixtures in headline news. Investors and financial product providers have been questioning the implications of market concentration on investment outcome. Growth/Value Style Indexes and capped indexes offer investment participants the tools to express their view on the future of the Seven while maintaining equity exposures.
To learn more about our Russell Indices go to Russell 1000 ICB Industry Capped Indices.

Disclaimer
© 2023 London Stock Exchange Group plc and its applicable group undertakings (the “LSE Group”). The LSE Group includes (1) FTSE International Limited (“FTSE”), (2) Frank Russell Company (“Russell”), (3) FTSE Global Debt Capital Markets Inc. and FTSE Global Debt Capital Markets Limited (together, “FTSE Canada”), (4) FTSE Fixed Income Europe Limited (“FTSE FI Europe”), (5) FTSE Fixed Income LLC (“FTSE FI”), (6) The Yield Book Inc (“YB”) and (7) Beyond Ratings S.A.S. (“BR”). All rights reserved.
FTSE Russell® is a trading name of FTSE, Russell, FTSE Canada, FTSE FI, FTSE FI Europe, YB and BR. “FTSE®”, “Russell®”, “FTSE Russell®”, “FTSE4Good®”, “ICB®”, “The Yield Book®”, “Beyond Ratings®” and all other trademarks and service marks used herein (whether registered or unregistered) are trademarks and/or service marks owned or licensed by the applicable member of the LSE Group or their respective licensors and are owned, or used under licence, by FTSE, Russell, FTSE Canada, FTSE FI, FTSE FI Europe, YB or BR. FTSE International Limited is authorised and regulated by the Financial Conduct Authority as a benchmark administrator.
All information is provided for information purposes only. All information and data contained in this publication is obtained by the LSE Group, from sources believed by it to be accurate and reliable. Because of the possibility of human and mechanical error as well as other factors, however, such information and data is provided "as is" without warranty of any kind. No member of the LSE Group nor their respective directors, officers, employees, partners or licensors make any claim, prediction, warranty or representation whatsoever, expressly or impliedly, either as to the accuracy, timeliness, completeness, merchantability of any information or of results to be obtained from the use of FTSE Russell products, including but not limited to indexes, data and analytics, or the fitness or suitability of the FTSE Russell products for any particular purpose to which they might be put. Any representation of historical data accessible through FTSE Russell products is provided for information purposes only and is not a reliable indicator of future performance.
No responsibility or liability can be accepted by any member of the LSE Group nor their respective directors, officers, employees, partners or licensors for (a) any loss or damage in whole or in part caused by, resulting from, or relating to any error (negligent or otherwise) or other circumstance involved in procuring, collecting, compiling, interpreting, analysing, editing, transcribing, transmitting, communicating or delivering any such information or data or from use of this document or links to this document or (b) any direct, indirect, special, consequential or incidental damages whatsoever, even if any member of the LSE Group is advised in advance of the possibility of such damages, resulting from the use of, or inability to use, such information.
No member of the LSE Group nor their respective directors, officers, employees, partners or licensors provide investment advice and nothing in this document should be taken as constituting financial or investment advice. No member of the LSE Group nor their respective directors, officers, employees, partners or licensors make any representation regarding the advisability of investing in any asset or whether such investment creates any legal or compliance risks for the investor. A decision to invest in any such asset should not be made in reliance on any information herein. Indexes cannot be invested in directly. Inclusion of an asset in an index is not a recommendation to buy, sell or hold that asset nor confirmation that any particular investor may lawfully buy, sell or hold the asset or an index containing the asset. The general information contained in this publication should not be acted upon without obtaining specific legal, tax, and investment advice from a licensed professional.
Past performance is no guarantee of future results. Charts and graphs are provided for illustrative purposes only. Index returns shown may not represent the results of the actual trading of investable assets. Certain returns shown may reflect back-tested performance. All performance presented prior to the index inception date is back-tested performance. Back-tested performance is not actual performance, but is hypothetical. The back-test calculations are based on the same methodology that was in effect when the index was officially launched. However, back-tested data may reflect the application of the index methodology with the benefit of hindsight, and the historic calculations of an index may change from month to month based on revisions to the underlying economic data used in the calculation of the index.
This document may contain forward-looking assessments. These are based upon a number of assumptions concerning future conditions that ultimately may prove to be inaccurate. Such forward-looking assessments are subject to risks and uncertainties and may be affected by various factors that may cause actual results to differ materially. No member of the LSE Group nor their licensors assume any duty to and do not undertake to update forward-looking assessments.
No part of this information may be reproduced, stored in a retrieval system or transmitted in any form or by any means, electronic, mechanical, photocopying, recording or otherwise, without prior written permission of the applicable member of the LSE Group. Use and distribution of the LSE Group data requires a licence from FTSE, Russell, FTSE Canada, FTSE FI, FTSE FI Europe, YB, BR and/or their respective licensors.