
Overview of Yield Book Classic
The Yield Book is a trusted and authoritative source for fixed income analytics that enables market makers and institutional investors to perform complex and accurate portfolio analysis and risk management.
Useful links
Features & benefits
Portfolio analysis and risk management
Market tested models
Use our sophisticated models for trade and portfolio applications. Term structure models, mortgage and asset-backed prepayment models, and default and loss severity models serve as the backbone for analysing option-adjusted spread, effective duration, convexity, and a wide range of other value and risk measures. Models are calibrated across a variety of security types.
Financial models
Used by broker-dealers, institutional investors, government agencies, consultants and educational institutions.
- Models calculate consistent risk and return measures for all security types.
- Sophisticated architecture allows users to quickly execute computationally intensive calculations.
- Flexible settings enable users to prepare customised analyses
Yield curve models
- Treasury model curve
- LIBOR swap curve
- Corporate credit curves
- Government (global) curves
- Swap (major currencies) curves
- On-the-run
- Fitted live and historical

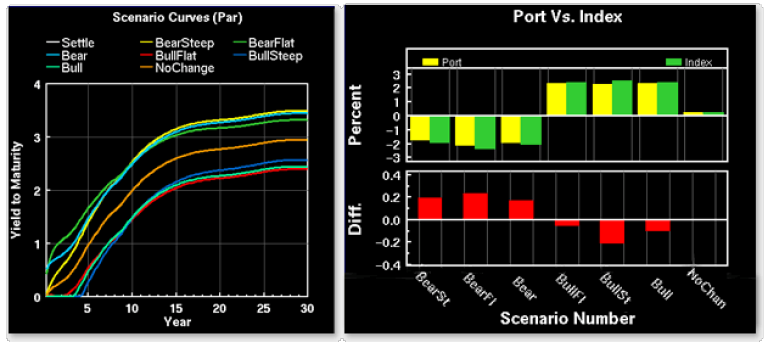
Yield Book provides government yield and swap curves for Euro participating and non-participating countries. For US dollar securities, users have the choice of using an interpolated on-the-run curve or a proprietary off-the-run fitted yield curve, called the treasury model curve. This curve, pictured in yellow in the graph, provides relative value analysis for treasury securities. The OAS to the treasury model curve indicates a bond's relative value. When doing pricing calculations, users can select whether their spread output is computed relative to a government, a swap, or a corporate credit curve.
Prepayment models
- Mortgage prepay model
- ABS issuer specific prepayment models
- Japanese GHLC model
- Dutch model
- CMBS default model
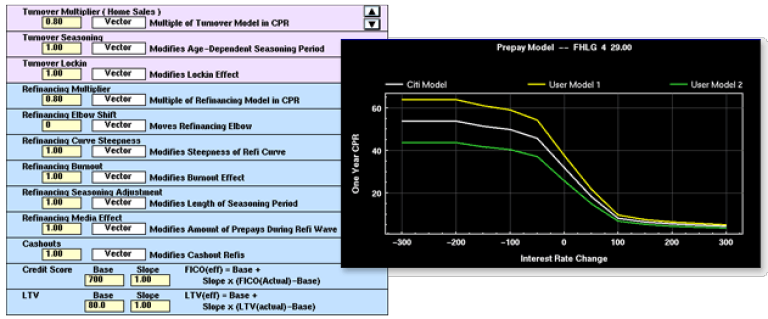
Prepayment projections are key to the analysis and evaluation of all mortgage backed securities. The mortgage prepayment model incorporation in Yield Book allows users the choice of running the model "as is" or customising the model by modifying various "dials" for prepayment factors, including the effect of housing turnover or refinancing. The sample page illustrates the effect of modifying the refinancing threshold on prepayments.
Term structure of volatility models
- Market volatilities
- Historical volatility
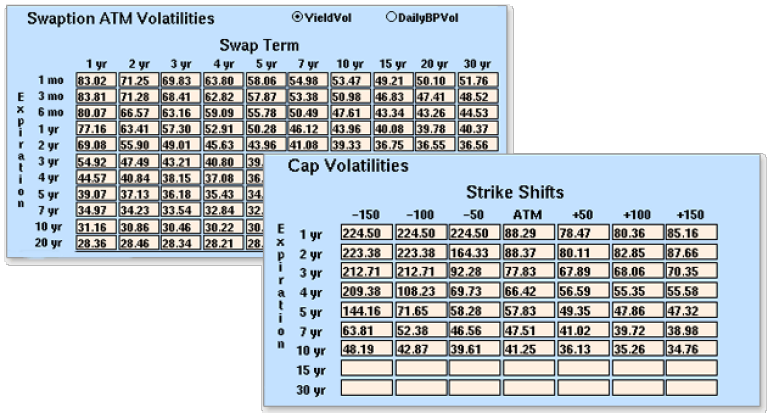
Yield Book's interest rate models are calibrated using a term structure of volatility. This allows a more accurate evaluation of securities with embedded options (e.g. calls, puts, sinking funds, caps, floors, prepayments, etc.). The sample page below shows Yield Book's curve analysis page, which allows users to display and analyse current and historical yield curves. The graph shows the projected dispersion (the expected path within an 80% probability band) of the 3-month swap rates derived from the term structure of volatility model.
Futures delivery option model
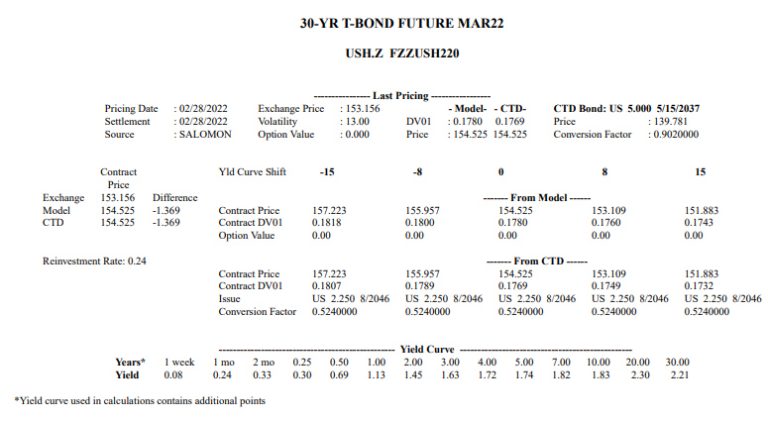
The futures delivery option model calculates the futures price, the value of the option, and the price sensitivities (DV01 and CV01). The delivery option model analyses all of the underlying deliverable bonds, including any special financing rates. The model DV01 is used for hedging and risk analysis. The model futures price can be compared to the marked price to determine relative value (trading the basis).
Trade and portfolio
To assist Portfolio Managers in analysing their trade ideas and portfolio strategies, Yield Book is capable of addressing scenarios involving individual securities, multiple security types, or portfolios, and in one or more currencies. Yield Book also provides the ability to easily customise reports.
Portfolio profiles:
Yield Book provides government yield and swap curves for Euro participating and non-participating countries. For US dollar securities, users have the choice of using an interpolated on-the-run curve or a proprietary off-the-run fitted yield curve, called the treasury model curve. This curve, pictured in yellow in the graph, provides relative value analysis for treasury securities. The OAS to the treasury model curve indicates a bond's relative value. When doing pricing calculations, users can select whether their spread output is computed relative to a government, a swap, or a corporate credit curve.
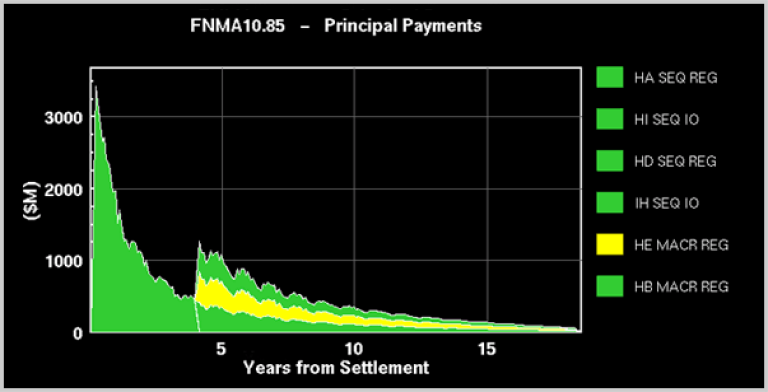
Cash flow analysis:
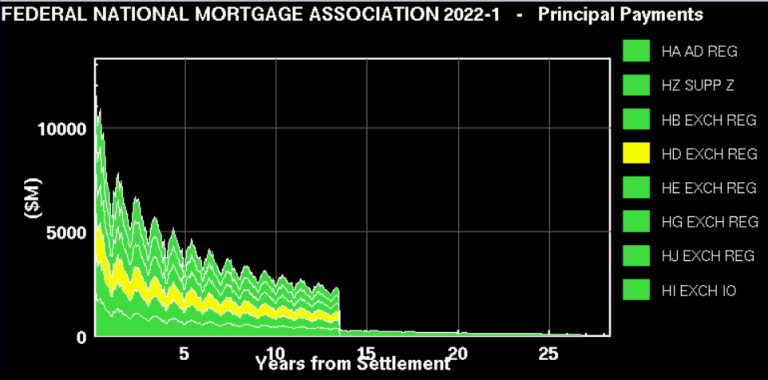
Generate issue specific and portfolio scenario dependent cashflows. Compare the cashflows to scenario dependent liabilities or to the cashflows of a benchmark portfolio. The scenarios can be parallel shifts, reshapings, multiple yield curve shocks, and currency exchange rate projections. Yield Book utilises its financial models (term structure model, mortgage prepayment model, corporate option model, etc.) to project each security's cashflow for each interest rate scenario. The sample graph displays the projected cashflows of XYZCO portfolio for a "bearish steepening" scenario.
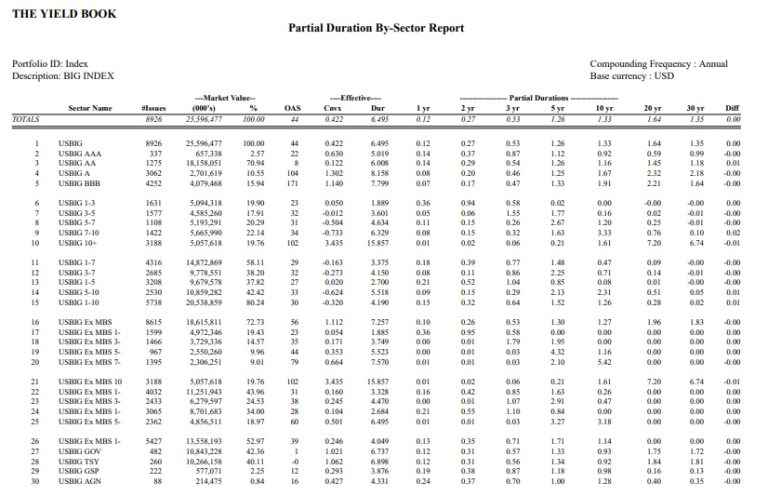
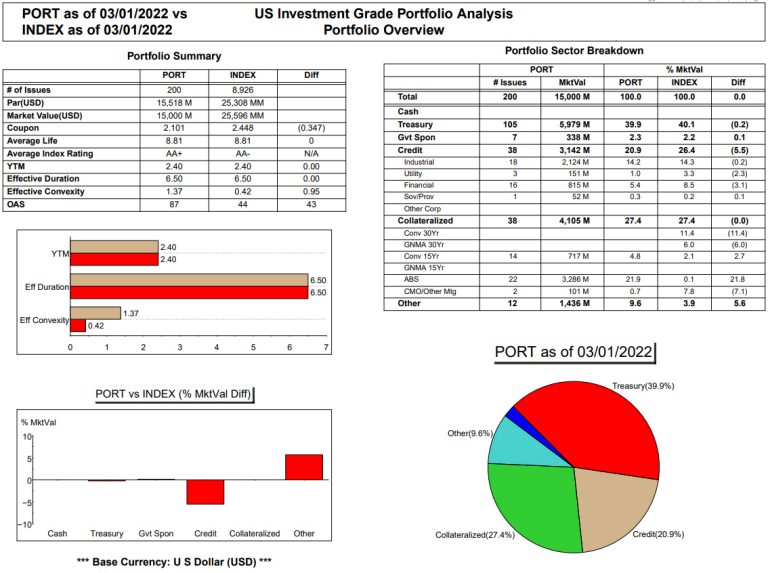
Risk analysis:
Calculate a wide range of issue specific and portfolio risk measures including: effective duration, partial (key rate) durations, effective convexity, volatility duration, spread duration, current coupon spread duration, prepay duration, refi-prepay duration, and turnover-prepay duration. The sample report compares the partial durations of XYZPORT to the FTSE world broad investment-grade bond index within major industry groups.
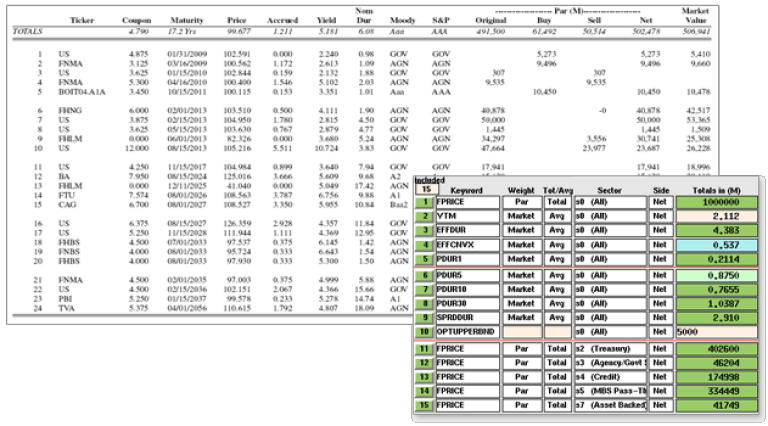
Flexible reports:
In addition to the dozens of pre-defined reports, users can create their own customised report templates. The columns can be any combination of hundreds of Yield Book keywords, user defined keywords, or user defined functions. The rows can be individual securities or sectors averages.
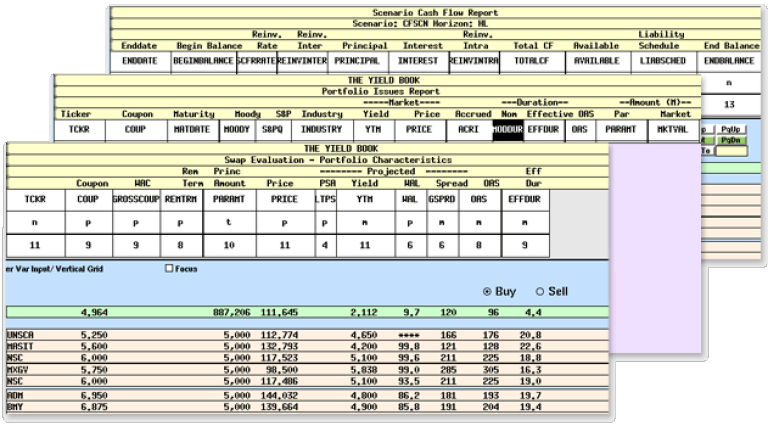
Portfolio optimisation:
Yield Book incorporates a powerful yet user friendly optimiser for calculating optimised trade weightings and structured portfolios (index tracking portfolios, cash matched portfolios, etc.). The objective and constraints can be defined using any of hundreds of security measures including scenario returns, cash flows, yield measures, risk measures, etc.). In addition, upper and/or lower bounds can be defined on the issue, issuer, or sector level. The sample page shows the result of a projected optimisation to maximise the returns of XYZPORT relative to the BIGINDEX across seven reshaping scenarios.
Scenario analysis:
Calculate projected issue specific and portfolio scenario rates of return (ROR). Compare the portfolio's scenario RORs to the RORs of the benchmark. The scenarios can be parallel shifts, reshapings, multiple yield curve shocks, and currency exchange rate projections. Yield Book utilises its financial models (term structure model, mortgage prepayment model, corporate option model, etc.) to project each security's cashflow for each interest rate scenario. The sample graph displays the RORs of XYZCO portfolio to the RORs of the BIGINDEX across seven reshaping scenarios.
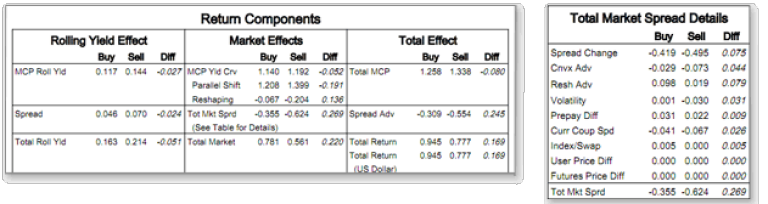
Return attribution:
Get a better understanding of the sources of return for individual securities, trades, and portfolios (including dynamic portfolios). Yield Book dissects total returns into treasury components (returns due to the yield curve; rolling yield, parallel shift, and reshaping) and spread advantage (returns in excess of the yield curve; spread, spread change, convexity advantage, reshaping advantage, volatility change, current coupon spread change, prepayment dif, etc). By comparing the portfolio's return components and sector weightings to a benchmark, Yield Book measures the issue selection and sector weighting effects.
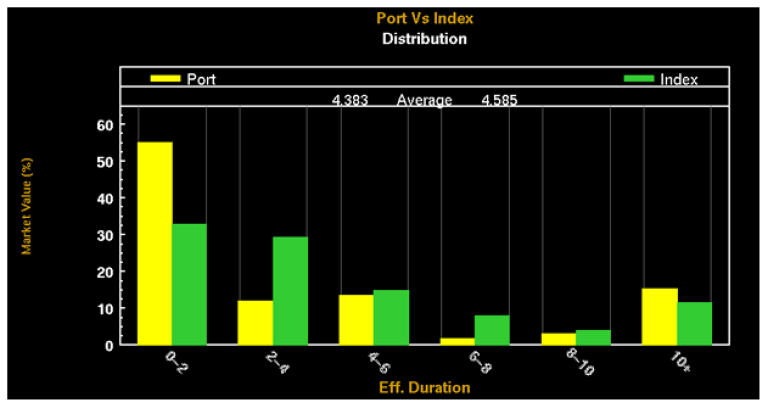
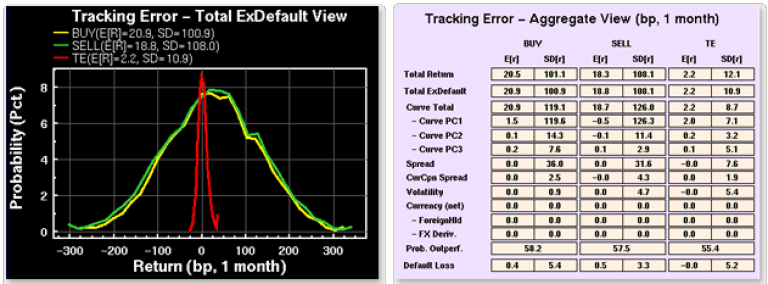
Tracking error:
Yield Book tracking error module conducts tracking error and risk decomposition analysis at the security, trade, portfolio, and portfolio versus benchmark level. The model employs a principal component approach to capture historical risk factor changes for 800+ global risk factors and a simulation-based methodology to project changes for these risk factors. The sample page on the right shows total ex-default return distributions for a portfolio versus benchmark analysis; distributions are shown at the portfolio, benchmark, and portfolio versus benchmark level.
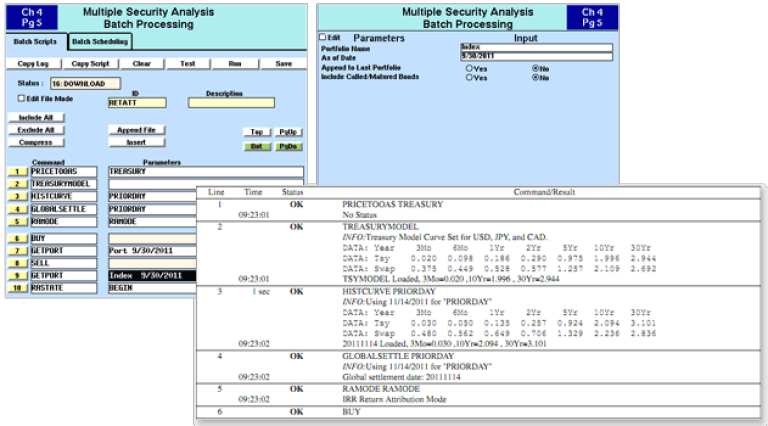
Batch scripts:
Automate Yield Book operations including portfolio uploads, pricing, scenario analysis, return attribution, report generation and downloads. Batch jobs can be set to run overnight on a daily, weekly, or monthly frequency, so that results are waiting for you the next day.
Quick report packages:
In addition to the dozens of pre-defined reports, users can create their own customised report templates. The columns can be any combination of hundreds of Yield Book keywords, user defined keywords, or user defined functions. The rows can be individual securities or sectors averages.
Comprehensive bond, index, and market data
The extensive securities database provides you with indicative data, daily pricing and analytics. The database covers most major fixed income asset classes and currencies. real-time market data, historical time series data, and daily pricing and analytics provide the tools for powerful analysis. Access to indices fuels benchmark analysis and provide insight on market trends.
Extensive securities database
Yield Book analytics calculate consistent yield, risk, and return measures for a broad spectrum of bonds, enabling users to perform analysis on portfolios composed of a wide range of fixed income security types.
Indicative data
Our continuously updated database maintains coupon rate, credit rating, redemption schedules, prepayment history, and other indicative data for a large number of securities.
Daily pricing
We provide daily prices, yields, option-adjusted spreads, effective durations, and other calculated values for over 20,000 securities, including all securities in our family of indices. We also provide matrix pricing tools and benchmark data (yield curves, volatility curves, "leader" prices, etc.) to allow users to create relationship-based pricing for virtually any bond.
Real-time yield curve
We provide a real-time on-the-run treasury yield curve, which allows intra-day pricing updates when used in conjunction with our matrix pricing tools. The fitted treasury model curve can also be updated with real-time inputs and can be used for pricing.
Trades analysis
We provide historical Yields, Prices, Spreads, and other measures for securities, market benchmarks, and yield curves, dating back to as early as 1950.
International and emerging Markets
Customers can easily search for securities satisfying multiple investment criteria
Personal database
In addition to access to the Yield Book databases, each user is provided a personal database that can be used to store portfolio holdings, customised indices, user created bond structures, and customised calculated values for any set of securities.
Securities types
Yield Book analytics calculate consistent yield, risk, and return measures for a broad spectrum of bonds, enabling users to perform analysis on portfolios composed of a wide range of fixed income security types.
Governments
- Treasury bonds, notes, bills, strips
- Agency bonds, MTNs
Corporates
- Bonds, MTNs
- Floaters
- Eurobonds
Mortgage
- Fixed rate pass through pools
- ARMs, ARM Jr-Sr
- Mortgage derivatives (CMO, IO/PO, floaters)
- ABS (home equity loan, manufactured housing, credit cards, auto loans)
- CMBS
Trades analysis
- Options on bonds
- Futures, options on futures, eurodollar futures, bankers' acceptance futures
- Swaps, swaptions
- Caps & floors
- Credit default swaps
International and emerging markets
- All major government bond markets
- North America, Europe, Asia Pacific, Latin America, The Middle East, and Africa
- Currency forwards
- Cross currency swaps
User defined securities
- Users are able to create their own structures for inclusion with the database and into portfolios for analysis
Indices
Yield Book customers have access to a set of FTSE Russell's domestic and international fixed income indices, as well as select third-party indices.
Issue level detail
Issue-level information is available on a set of FTSE Russell's fixed income indices and sub-indices, and on iBoxx Euro and Sterling indices. This allows for the comparison of portfolios to their appropriate index benchmark.
Index data
Comprehensive notes, tables, and other documentation of fixed income index data are available on yieldbook.com.
Customised indices
Since indices are available on an issue level basis, customised indices can be constructed by selecting and re-weighting any of the components.
Historical returns
Historical returns and descriptive measures are provided for fixed income indices and published sectors since inception, since inception in 1980. In addition, statistical analysis can be performed on the historical measures, as well as re-weighting of the indices.
Analytics at your desktop or on the network
Integrate Yield Book analytics with your in-house applications on your desktop. The client/server architecture offers the convenience of live updates of data and models, along with the capacity for large scale portfolio and index calculations. The same high performance analytics are available over the internet. In addition, batch scripting and batch-on-demand production management tools empower your organisation to automate large-scale calculations to meet your analytic needs.
Architecture
Yield Book architecture enables users' convenience of running the system on their desktop computer via a dedicated connection or Internet connection, while accessing the power of our central calculation facility.
Displays on your desktop computer
Display Yield Book on your current PC or Unix workstation along with other applications. Integrate Yield Book with your accounting system, spreadsheets, and other applications by connecting it to your local area network.
Powerful central servers
Yield Book runs on powerful central servers which are supported by both database and compute servers. This architecture affords complex database searching capability and streamlined calculation times through parallel processing.
Automatic database updates
Connect each morning to the most up-to-date market information. Updates to the indicative data on securities and pricing calculations based on market closes are processed each night on our servers. The client/server architecture eliminates the need for time-consuming downloads to refresh data.
Service and custom solutions
Call on our fixed income analysts and systems engineers to address your usage and technical questions. Join us for hands on customer workshops in locations across the globe. Consulting expertise is available upon request to work with you to create customised solutions for your analytic needs.
* Screenshots are sourced from Yield Book. For illustrative purposes only.
Request details
Email your local sales team
Help & Support
Already a customer?
Contact us
Sales
Telephone: +1 646 989 2200
Email: sales@yieldbook.com
Support
Telephone: +1 888 333 5618
Email: support@yieldbook.com
Help desk
Telephone: +1 888 333 5617
Email: howto@yieldbook.com