

Detlef Glow

Jack Fischer
Xav Feng
With bond yields now looking more appealing should investors once again look to bonds for income and potential diversification benefits?
Some investors seemed to be very happy when the European Central Bank (ECB) started to raise interest rates to fight the high inflation in the eurozone after a long period with exceptionally low interest rates. Some of these investors were swiftly brought back to reality when the rising rates caused – as to be expected – falling prices in the bond markets.
As Exhibit 9 depicts, the price for the seven-year EUR benchmark bond fell from 103.745 on 17 December 2021, to 85.571 on 19 May 2023. This 17.52% loss appeared when the respective yield of the seven-year EUR benchmark bond rose (from -0.53% to 2.34%).
This means that investors had to cope with falling prices even for the most liquid AAA-rated bonds over the course of 2022 and 2023 year to date. Since the ECB has already stated that it will increase the interest rate in the eurozone, we might witness further falling prices for bonds with a duration above money market instruments.
Nevertheless, bond holders who buy newly issued bonds and hold them until maturity will at least get some interest payments and should not experience any losses from an AAA-rated EUR bond, but they may face some paper losses during the holding period when they mark their bonds to market.
Exhibit 1: Bid yield (in % – right axis) and bid price (in EUR – left axis) for the seven-year EUR benchmark bond

Source: LSEG Datastream as of 31 March 2023
A closer look at the current euro bond yield curve shows that the yield curve is inverted, which means that short-term bonds and money market instruments pay higher interest rates than bonds with a longer duration. This means that it currently makes more sense for investors to buy bonds with a very short duration instead of medium- or long-term bonds.
Exhibit 2: Euro bond yield curve

Source: LSEG Datastream as of 18 May 2023
From my point of view, it is good for some investors that euro bonds pay interest rates because this may help them to achieve their return goals if they hold the respective bonds to maturity. On the other hand, it seems to be too early to buy bonds with a longer duration and speculate on a turnaround of the ECB’s interest rate policies because any further rate hikes by the ECB will lead to losses for bonds with a maturity above money market instruments.
That said, I think that it only makes sense to buy medium- or long-duration euro bonds when the yield curve has normalised and the ECB has stated that it will stop raising interest rates. In addition to this, investors need to bear in mind that they have to protect their purchasing power. This means they should only invest in bonds that will pay a higher interest rate than the expected average inflation rate over the holding period.
A topic which goes beyond this discussion is the impact of rising rates on the economy since rising rates lead to higher financing costs for corporations and consumers. This may impact the profitability and/or the ability/ willingness to spend money for new projects, which can already be observed in the real estate segment.
Jack Fischer
U.S. Fixed income funds outlook
Since 1972, the Federal Reserve has only increased its federal funds rate at a higher pace one other time (October 1980). As we know raising interest rates, at a high level, affects the cost of doing business and in doing so the supply and demand of an overall economy. With such a significant pace of rate hikes, we are bound to see both the intended and unintended consequences.
During 2022, U.S. taxable bond funds suffered outflows in each of the four quarters, with Q2 2022 (-$112.0 billion) setting an all-time record. Lipper Short Investment-Grade Debt (-$57.2 billion) and Lipper Multi-Sector Income Funds (-$49.6 billion) recorded the largest taxable fixed income classifications outflows during that year. The fixed income winners during 2022 were Lipper General U.S. Treasury Funds (+$66.5 billion) and Lipper Short U.S. Treasury Funds (+$55.3 billion). The drastic rise in short-term Treasury yields, amidst broader economic and geopolitical uncertainty, made shorter-duration, government-backed investments an ideal place to park funds. Fixed income was a tough place to be in 2022. Weathering the storm in shorter duration was essential, but now, with rate hikes set to pause, is it time to start looking at managers who have been positioning themselves to take advantage of what’s to come?
What is to come?
Over the last 12 months, active fixed income funds reported $165.5 billion in outflows versus passively managed’s $241.5 billion inflows. The tone from the last Federal Open Market Committee, paired with rather encouraging economic data, has investors increasingly believing in a rate-hiking pause. On the flip side, the debt ceiling drama and regional banking issues have cast an uneasy feeling over the market. Have we seen the last unintended consequence of this rate-hiking cycle, or do we have more to come?
At an asset-class level, market participants have flooded U.S. money market funds during Q1 2023 (+$412.9 billion) – the third highest quarterly inflow, trailing only Q1 2020 (+$724.0 billion) and Q4 2008 (+$424.5 billion). This trend is likely to continue. Fixed income funds reported their first quarterly inflow in Q1 2023 (+$70.4 billion) over the last five quarters. General U.S. Treasury Funds and Short U.S. Treasury Funds remain a hotbed for new inflows. Investors are betting on interest rate increases slowing or even pausing during the next Federal Open Market Committee meeting, meaning the times of two-year, government-backed debt yielding around 4.0% are coming to an end. In the short term, each movement upward in the short end of the yield curve will likely continue to attract inflows by investors looking to take advantage.
Exhibit 3: Lipper General U.S. Treasury Funds and Lipper Short U.S. Treasury Funds quarterly flows

Source: LSEG Lipper, as of 31 March 2023
One area that I will be focusing on for the remaining part of the year is corporate debt and specifically investment-grade debt funds. In terms of overall issuance, investment-grade corporate debt saw its first increase quarter-over-quarter since Q1 2022 – when the rate hikes started.
Exhibit 4: Quarterly issuance of investment-grade debt

Source: LSEG SDC Platinum as of 31 March 2023
We tend to look at investment-grade debt funds using three different Lipper classifications: Lipper Core Bond Funds, Lipper Short Investment-Grade Debt Funds and Lipper Short-Intermediate Investment-Grade Debt Funds. All three classifications logged annual outflows during 2022, with default risks rising and overall market conditions leading investors elsewhere. Now, with a forecast of interest rate stability and taming inflation, market participants are moving back into longer-duration, higher-quality credit. Core Bond Funds have at least 85% of their fund invested in investment-grade assets with average maturities of five to 10 years. Given the investment-grade spread volatility over the past few years, active managers have been looking for mispriced assets and may now be reaping the benefits of their due diligence.
Exhibit 5: Quarterly investment-grade debt flows by Lipper fund classification

Source: LSEG Lipper Global Fund Flows as of 31 March 2023
The active funds within the Core Bond Funds classification have only attracted $1.7 billion over the trailing 12 months (compared to passive’s +$18.4 billion). Year-to-date, however, active Core Bond Funds have pulled in $12.9 billion (versus passive’s +$13.7 billion). On average, since 2019, active funds within this classification have been overweight asset-backed securities, commercial mortgage-backed securities, municipal debt and cash versus their passive counterparts. Active managers who have been diligent in their credit research and overall processes will be poised to take advantage of mispricing opportunities that will occur during the rest of the year.
Active investment-grade debt funds won’t be the only winner at the end of this year. Another focus for me will be Multi-Sector Income Funds – yes, one of the biggest losers of 2022. This classification has already attracted $5.8 billion in inflows since the start of the year. This classification has a bit more leeway than Core Bond Funds, as Multi-Sector Income Funds tend to invest in several different sectors as long as no one sector is more than 65% of the portfolio (except for defensive purposes). These funds, on average, have slowly been increasing their allocation to sovereign debt and cash, also looking to take advantage when the timing is right. Using Lipper for Investment Management, the average cash allocation in active Multi-Sector Income Funds has moved up from 0.52% in Q3 2020 to 5.14% in Q1 2023. The big leap happened from Q4 2021 (+2.55%) to Q1 2022 (+4.46%), right when this rate hiking cycle began.
The Multi-Sector Income Funds classification suffered four straight monthly outflows to end 2022 and now is on pace for its fourth straight monthly inflow to start 2023.
In the short term, Treasuries and shorter-duration fixed income investments will continue to attract funds whenever the short part of the yield curve shows any movement upward. This will likely continue until we see our first pause or decrease in rates by the Federal Reserve. Investment-grade debt and multi-sector active managers have started to see inflows as investors pivot towards a longer investment horizon. My prediction for the end of the year is that active Core Bond Funds and Multi-Sector Income Funds will be the top two classifications in terms of inflows under taxable fixed income funds and may be the top-performing classifications by the end of 2024.
Xav Feng
Asia fixed income funds outlook
Unlike the U.S. Federal Reserve, ECB, or other Western central banks, most of Asia Pacific’s central banks’ monetary policies have been slower moving and more benign than their western counterparts. The Central Bank of the Philippines was the most aggressive amongst them all, hiking its key lending rate 400 basis points (bps) since last year, whilst Bank Indonesia has tightened 225 bps and the Bank of Thailand 100 bps. China remains one of the last few markets globally without an inflation issue, which reflects there is room for monetary easing to fend off an economic slowdown.
The MSCI China Index has lost almost all of its 18% rally in 2023, erasing $6.5 trillion in market value from its peak on 27 January. Last year, the Chinese 10-year government bond yielded as much as 110 bps more than its U.S. counterpart. China’s equity market has been range bound over the past three months and the yuan has weakened to below the level of seven against the U.S. dollar for the first time in five months. As investors sought the safety of government bonds, China’s benchmark 10-year bond yield declined 7 bps in April – its biggest monthly drop since October, falling to a six-month low.
China kept its benchmark lending rate unchanged for the ninth consecutive month in May, matching market expectations. Given the risk of capital outflows that could further hurt a sliding yuan, the market expects the People’s Bank of China (PBOC) to lower its reserve requirement ratio (RRR) or cut its policy rate as its next move. It triggered some investment opportunity for conservative investors to allocate some exposure to higher-quality Chinese bonds, such as government bonds, as a defensive position.
Exhibit 6: China government bond yield curve
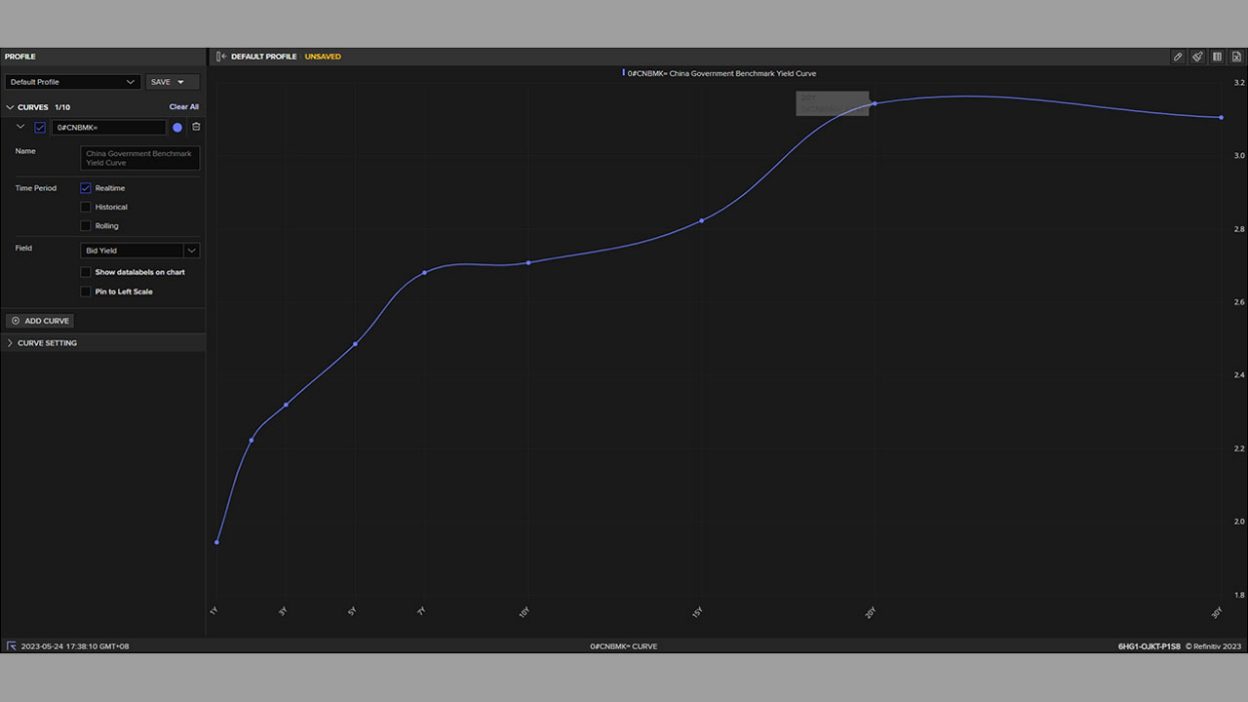
Source: LSEG Workspace
Legal Disclaimer
Republication or redistribution of LSE Group content is prohibited without our prior written consent.
The content of this publication is for informational purposes only and has no legal effect, does not form part of any contract, does not, and does not seek to constitute advice of any nature and no reliance should be placed upon statements contained herein. Whilst reasonable efforts have been taken to ensure that the contents of this publication are accurate and reliable, LSE Group does not guarantee that this document is free from errors or omissions; therefore, you may not rely upon the content of this document under any circumstances and you should seek your own independent legal, investment, tax and other advice. Neither We nor our affiliates shall be liable for any errors, inaccuracies or delays in the publication or any other content, or for any actions taken by you in reliance thereon.
Copyright © 2023 London Stock Exchange Group. All rights reserved.
The content of this publication is provided by London Stock Exchange Group plc, its applicable group undertakings and/or its affiliates or licensors (the “LSE Group” or “We”) exclusively.
Neither We nor our affiliates guarantee the accuracy of or endorse the views or opinions given by any third party content provider, advertiser, sponsor or other user. We may link to, reference, or promote websites, applications and/or services from third parties. You agree that We are not responsible for, and do not control such non-LSE Group websites, applications or services.
The content of this publication is for informational purposes only. All information and data contained in this publication is obtained by LSE Group from sources believed by it to be accurate and reliable. Because of the possibility of human and mechanical error as well as other factors, however, such information and data are provided "as is" without warranty of any kind. You understand and agree that this publication does not, and does not seek to, constitute advice of any nature. You may not rely upon the content of this document under any circumstances and should seek your own independent legal, tax or investment advice or opinion regarding the suitability, value or profitability of any particular security, portfolio or investment strategy. Neither We nor our affiliates shall be liable for any errors, inaccuracies or delays in the publication or any other content, or for any actions taken by you in reliance thereon. You expressly agree that your use of the publication and its content is at your sole risk.
To the fullest extent permitted by applicable law, LSE Group, expressly disclaims any representation or warranties, express or implied, including, without limitation, any representations or warranties of performance, merchantability, fitness for a particular purpose, accuracy, completeness, reliability and non-infringement. LSE Group, its subsidiaries, its affiliates and their respective shareholders, directors, officers employees, agents, advertisers, content providers and licensors (collectively referred to as the “LSE Group Parties”) disclaim all responsibility for any loss, liability or damage of any kind resulting from or related to access, use or the unavailability of the publication (or any part of it); and none of the LSE Group Parties will be liable (jointly or severally) to you for any direct, indirect, consequential, special, incidental, punitive or exemplary damages, howsoever arising, even if any member of the LSE Group Parties are advised in advance of the possibility of such damages or could have foreseen any such damages arising or resulting from the use of, or inability to use, the information contained in the publication. For the avoidance of doubt, the LSE Group Parties shall have no liability for any losses, claims, demands, actions, proceedings, damages, costs or expenses arising out of, or in any way connected with, the information contained in this document.
LSE Group is the owner of various intellectual property rights ("IPR”), including but not limited to, numerous trademarks that are used to identify, advertise, and promote LSE Group products, services and activities. Nothing contained herein should be construed as granting any licence or right to use any of the trademarks or any other LSE Group IPR for any purpose whatsoever without the written permission or applicable licence terms.